A conversation, thirteen screens, one set of rules.
Everything below is the live product, shown on a real park with its name and its rides' names hidden. The numbers on each screen are that park's real measured figures.
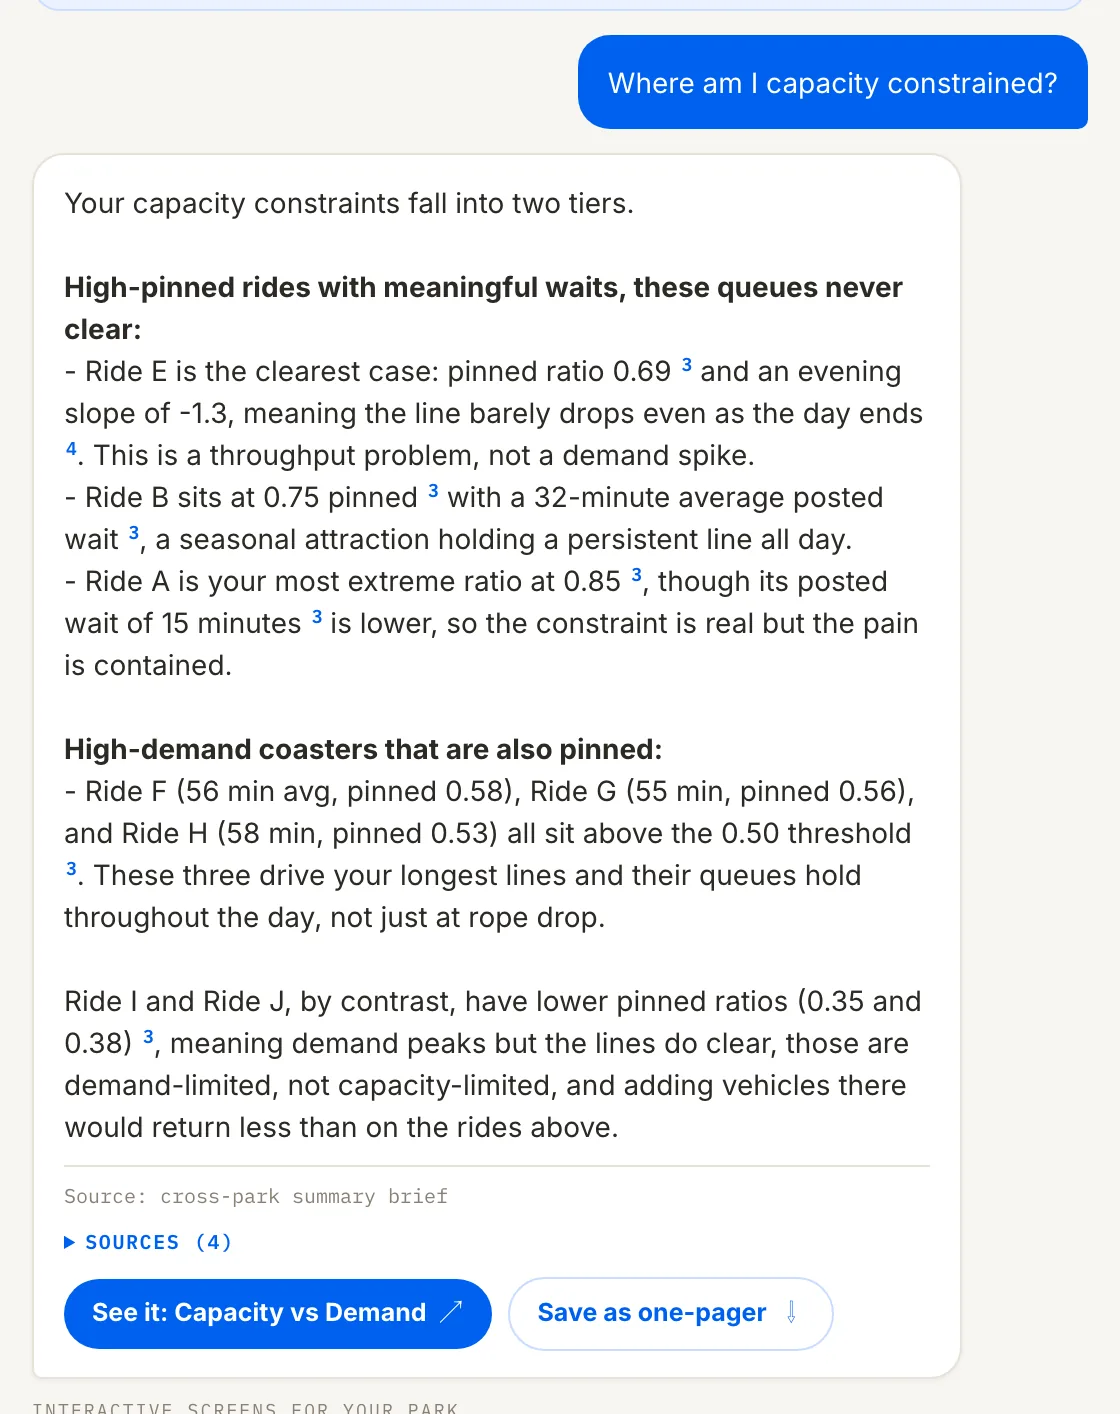
Plain questions, sourced answers.
The analyst picks the verified analyses that fit your question, runs them on your park, and answers from those results only.
The analyst
Answers cite their sources inline, carry their caveats, open the screen that shows the answer, and save as a one-pager.
Each numbered source shows where its figure came from: which analysis, how many days of data, how confident.
The day's read, before the gates open.
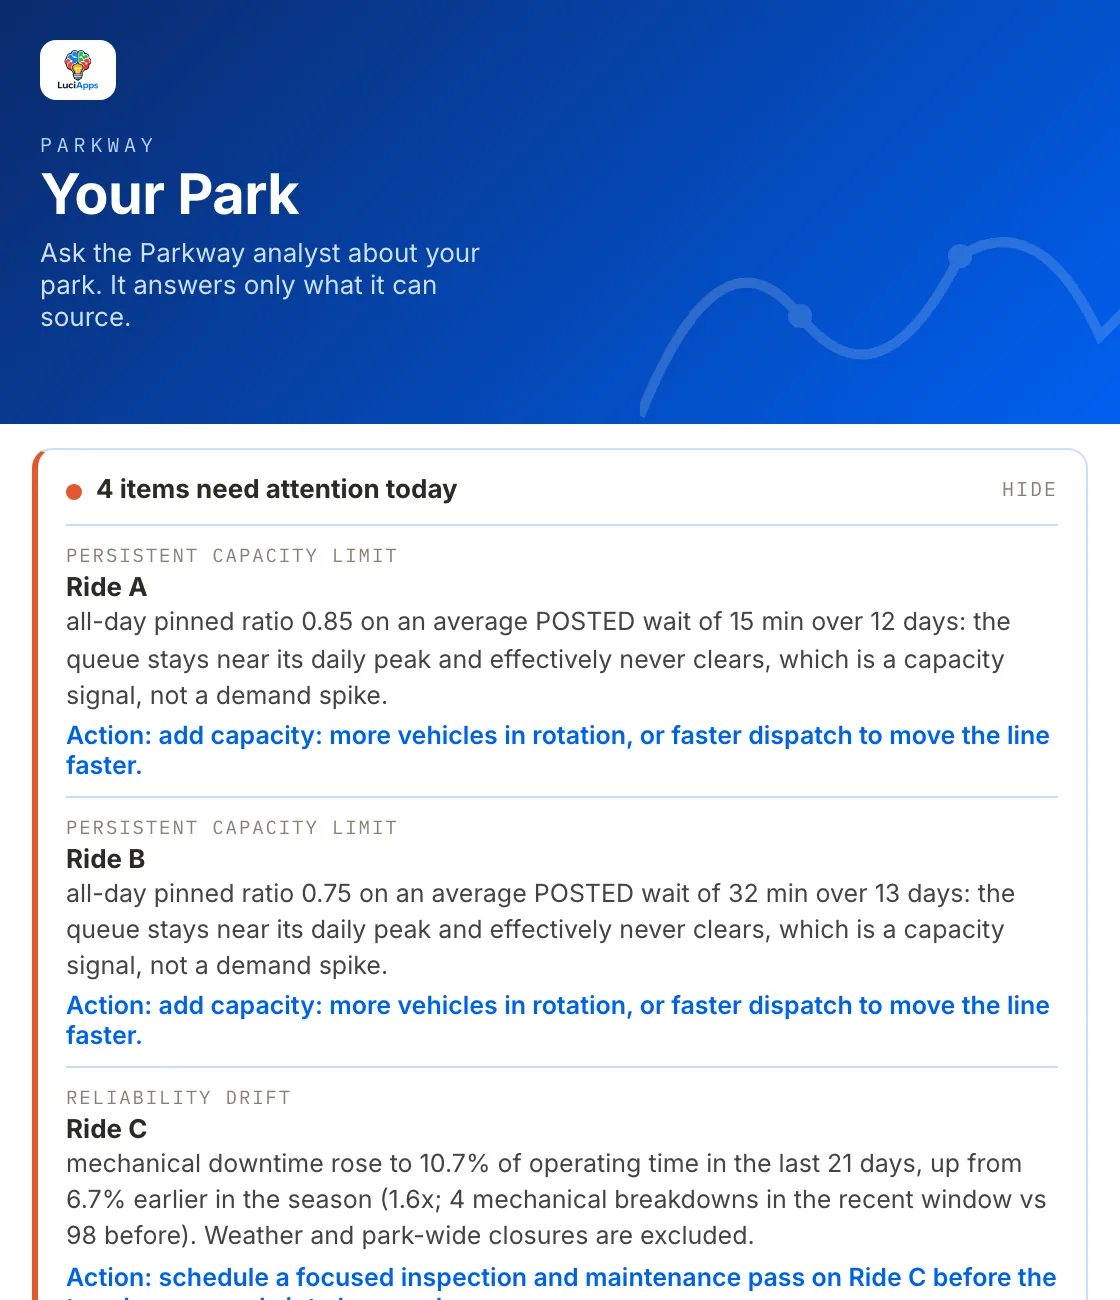
Two things arrive without anyone asking: a short list of what moved, and a one-page brief for the operations team.
Attention list
Ranked deviations from your park's own normal: rides whose queues stopped clearing, coasters whose mechanical downtime rose. Each item has its numbers and a suggested action.
It appears only when something crosses a severity gate, so a quiet day stays quiet. The same list can arrive by email.
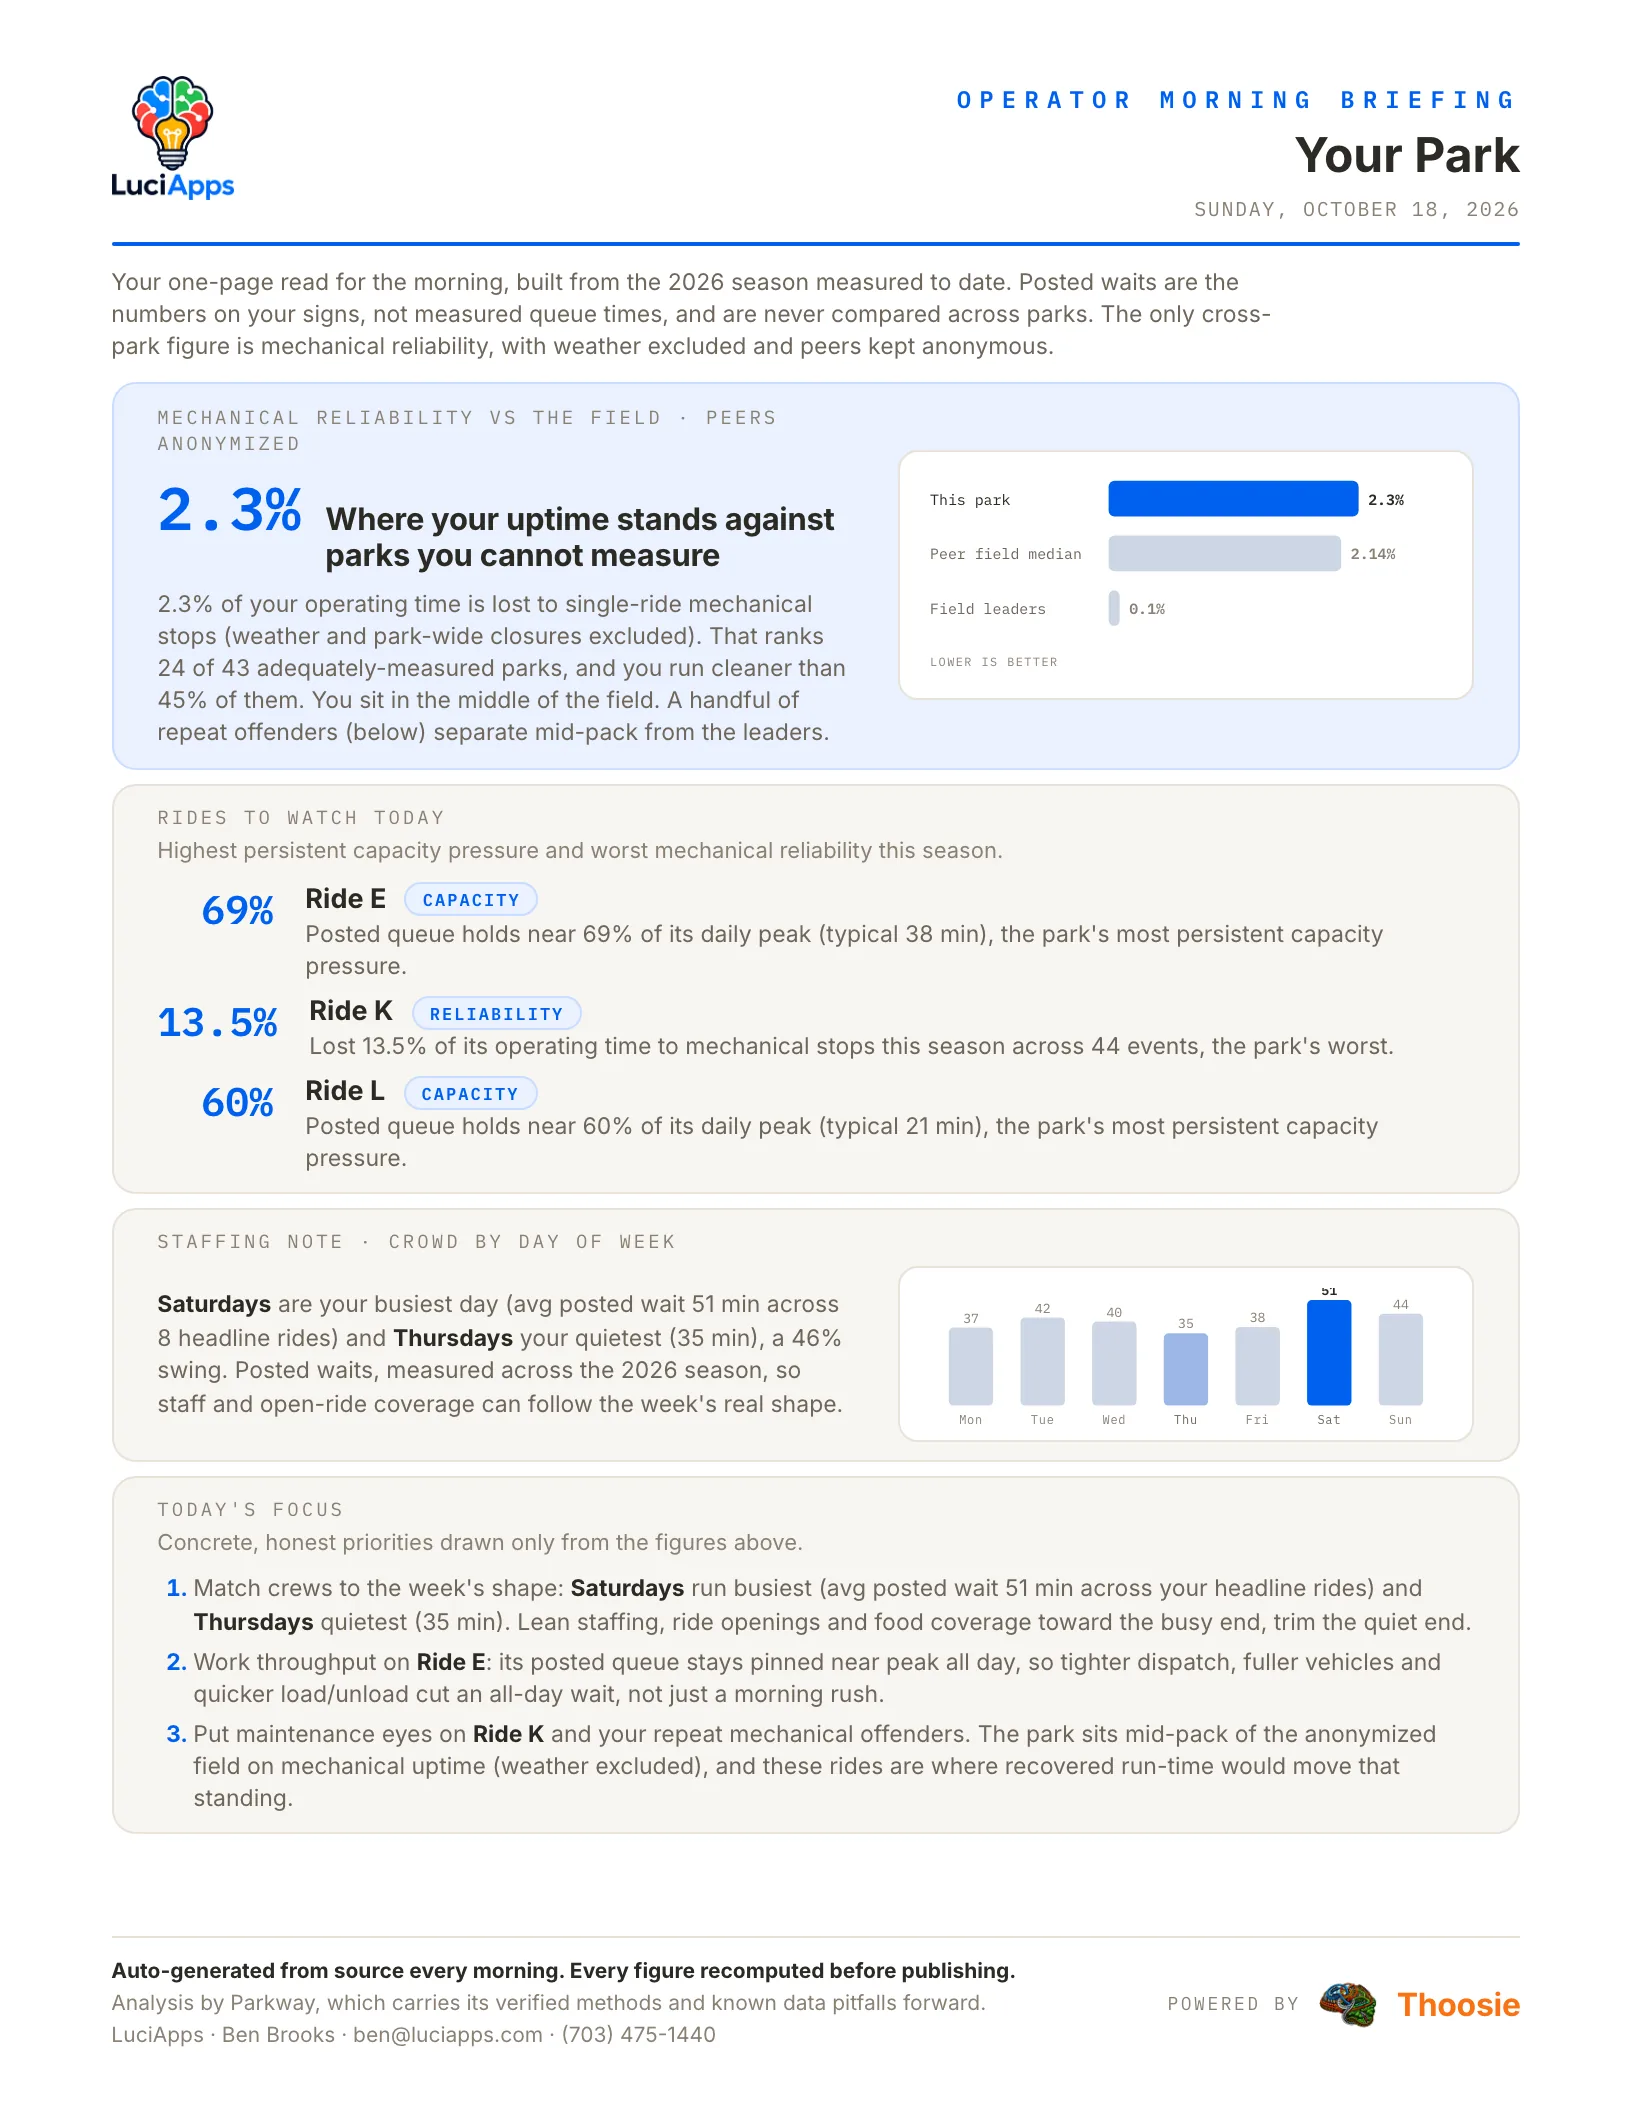
Morning Brief
A one-page read for the start of the day: mechanical reliability against the anonymized field, rides to watch, the week's staffing shape and today's priorities.
Rebuilt from source every morning, with versions for maintenance, revenue and food and beverage, and the general manager.
Where the day is won or lost.
Capacity, crowd shape and the operating day, read within your own park.
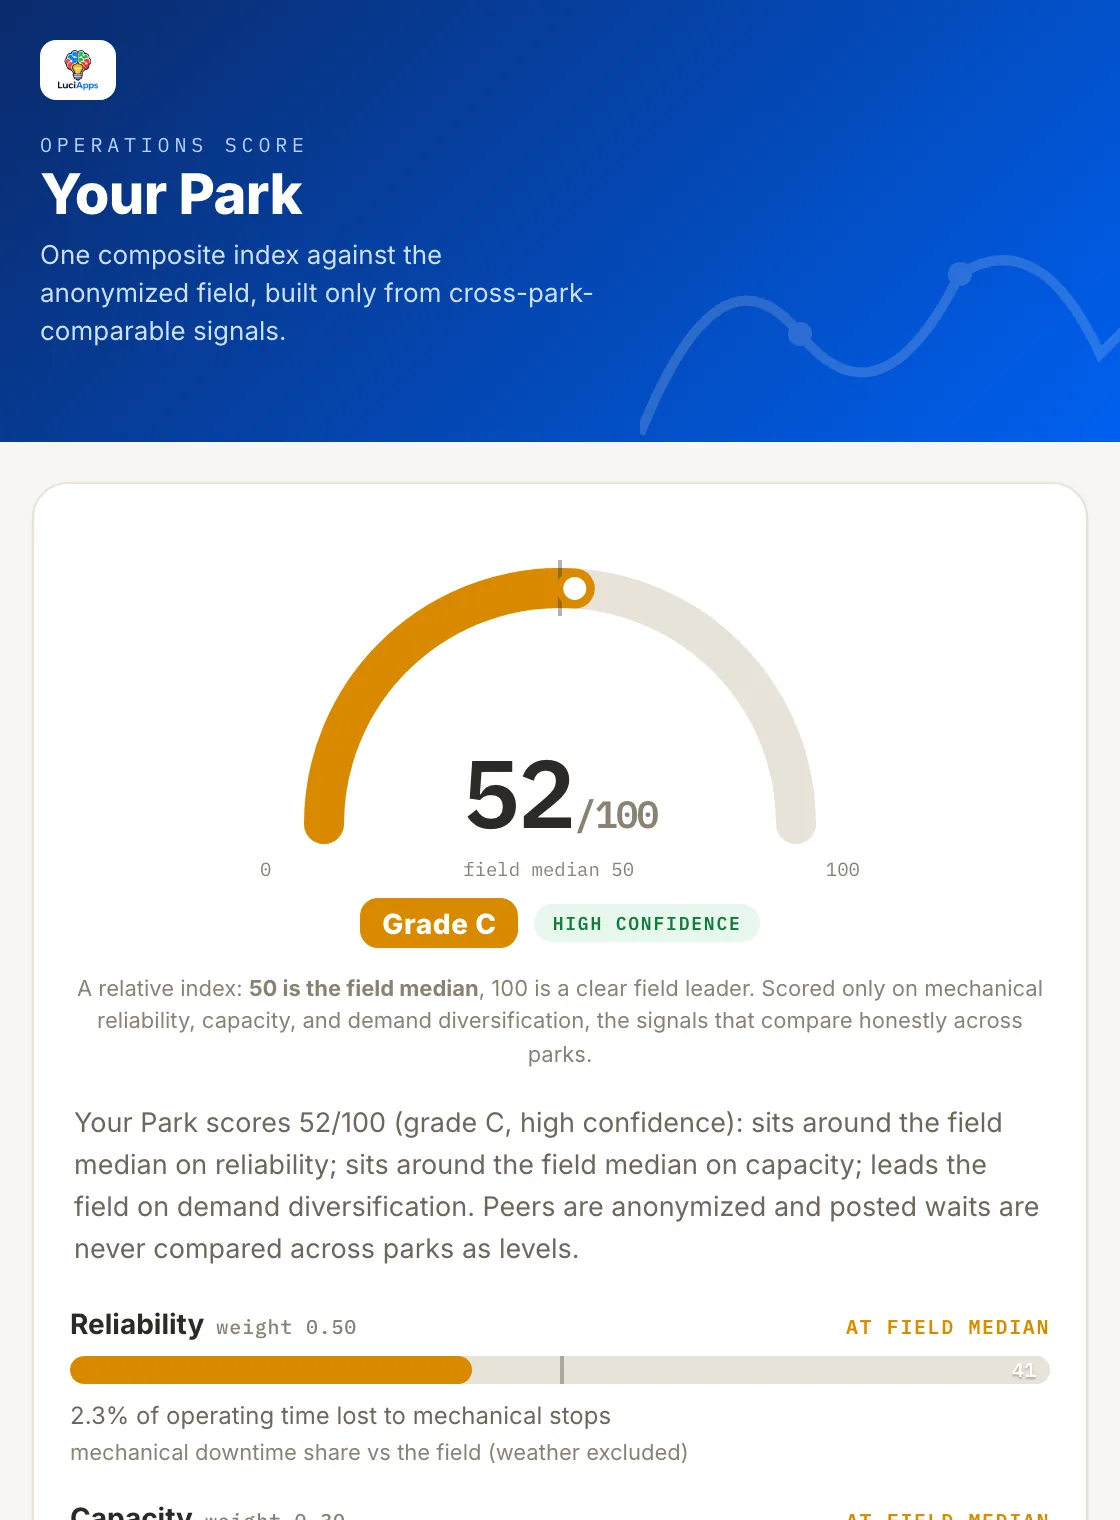
Operations Score
One 0 to 100 index per park, built from mechanical reliability, capacity and demand diversification. Each driver is shown against the field median, with a confidence grade.
A relative index: 50 is the field median. Built only from signals that compare honestly across parks.
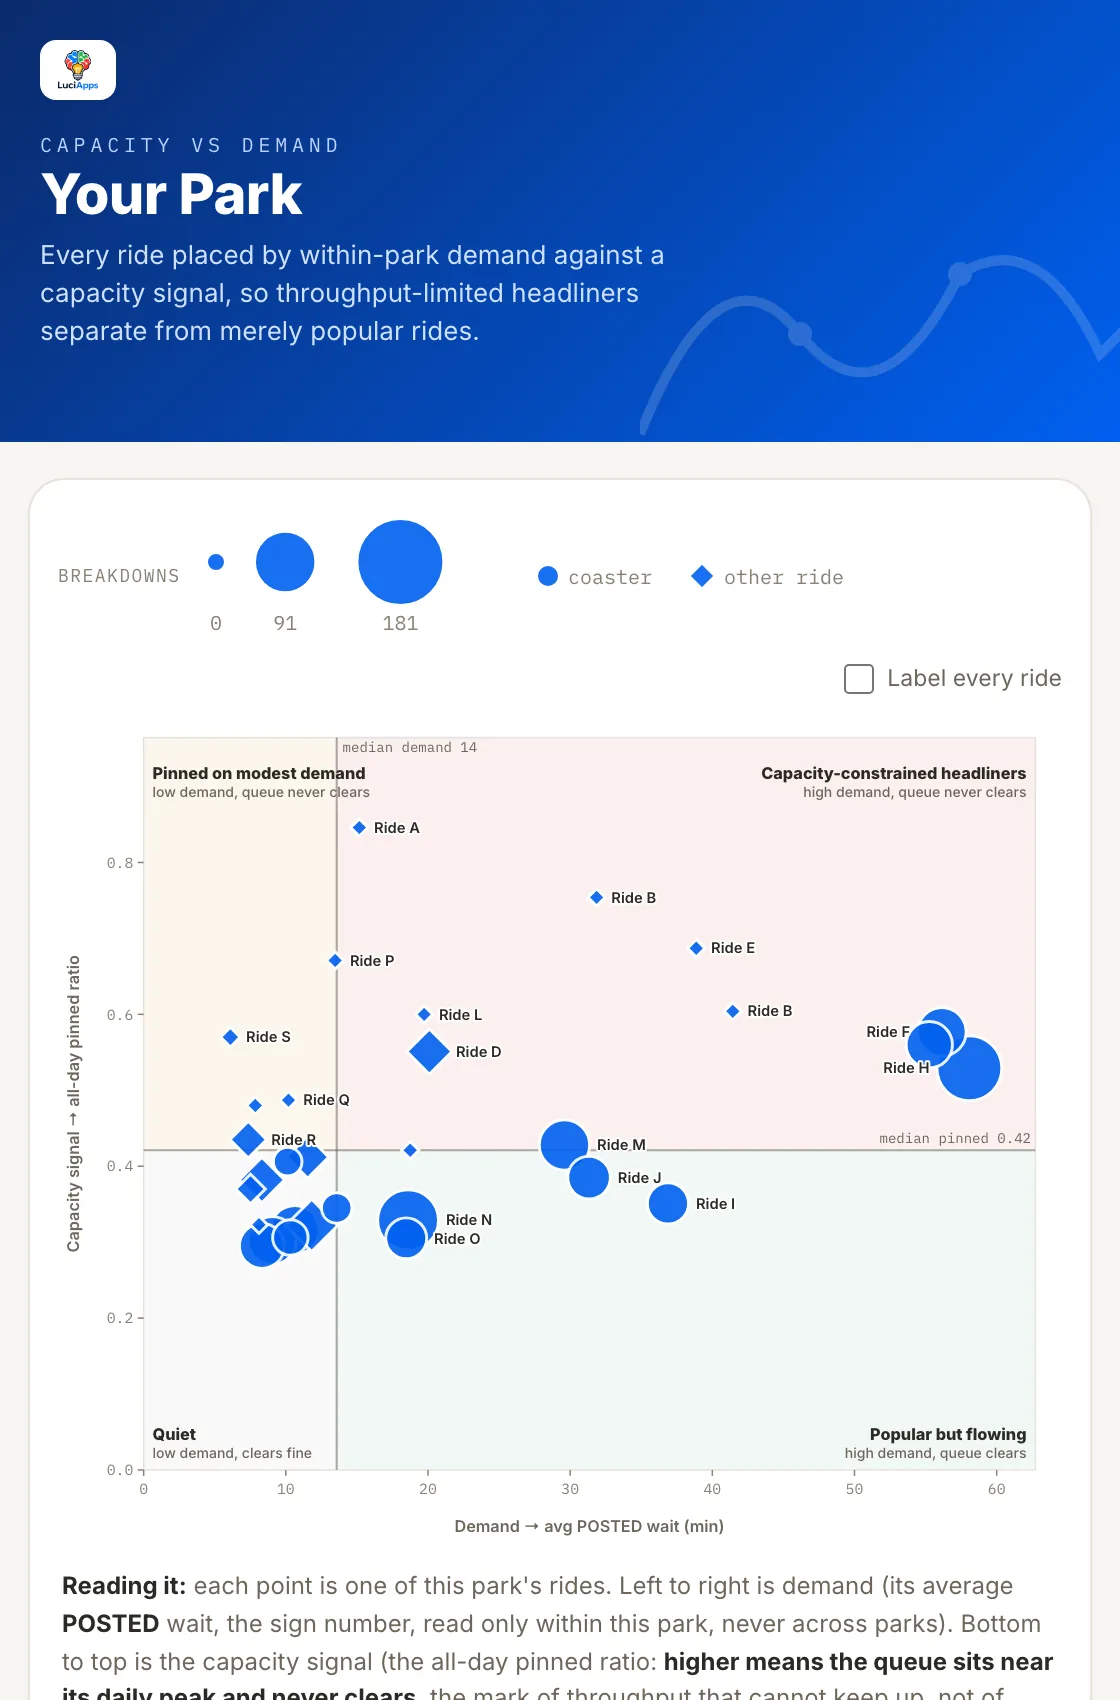
Capacity vs Demand
Every ride placed by demand against a capacity signal, the all-day pinned ratio. Throughput-limited headliners separate from rides that are merely popular.
Demand here is the posted wait, read within your park only. Point size is the ride's mechanical breakdowns this season.
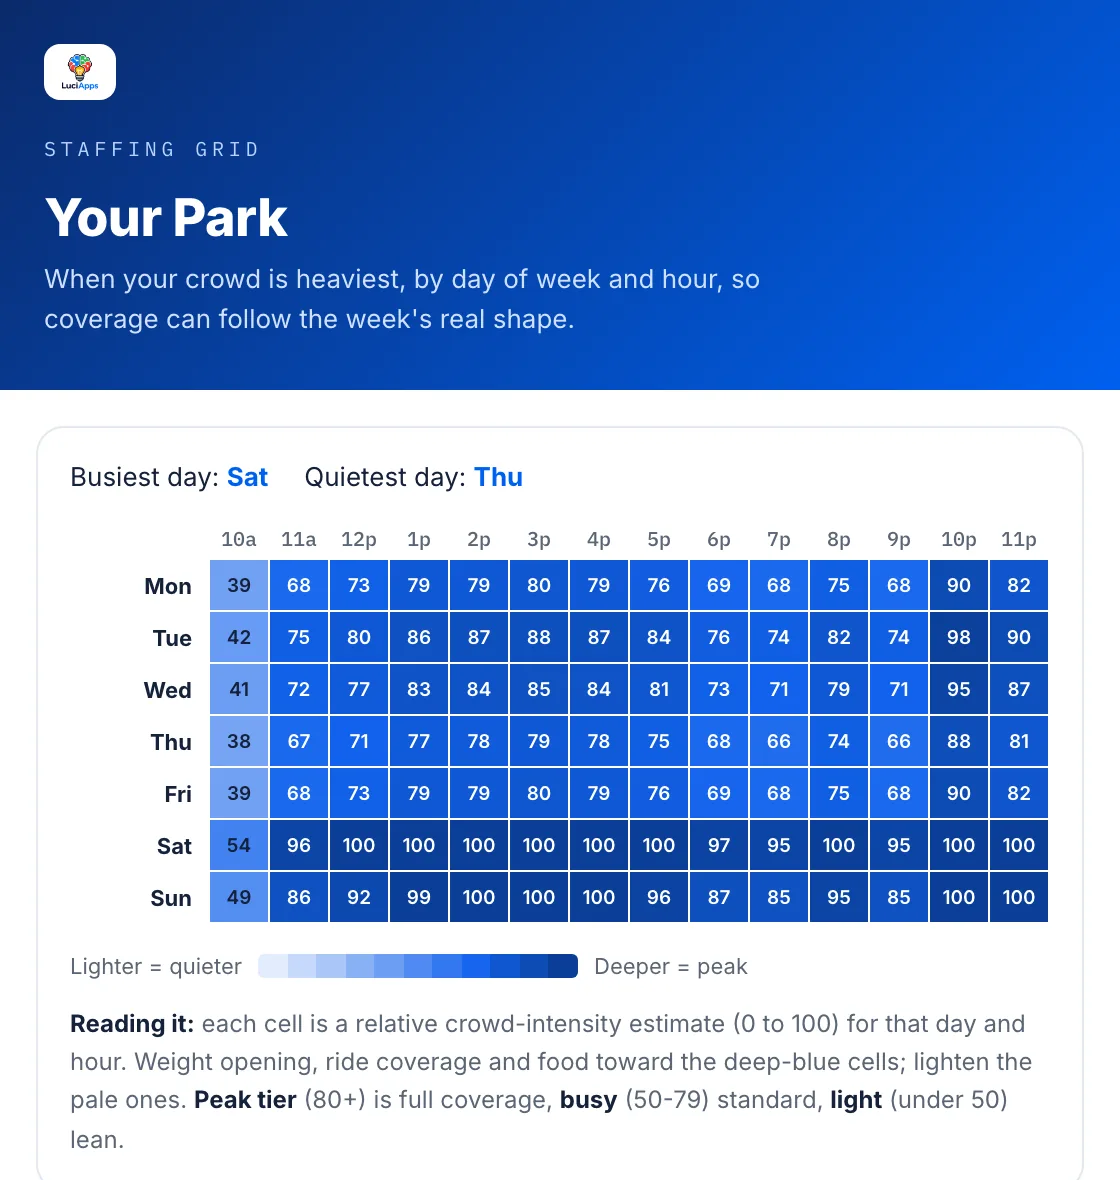
Staffing Grid
Crowd intensity by day of week and hour, so coverage follows the week's real shape. The busiest and quietest days are called out.
A within-park demand estimate from posted waits, not attendance, and never compared across parks.
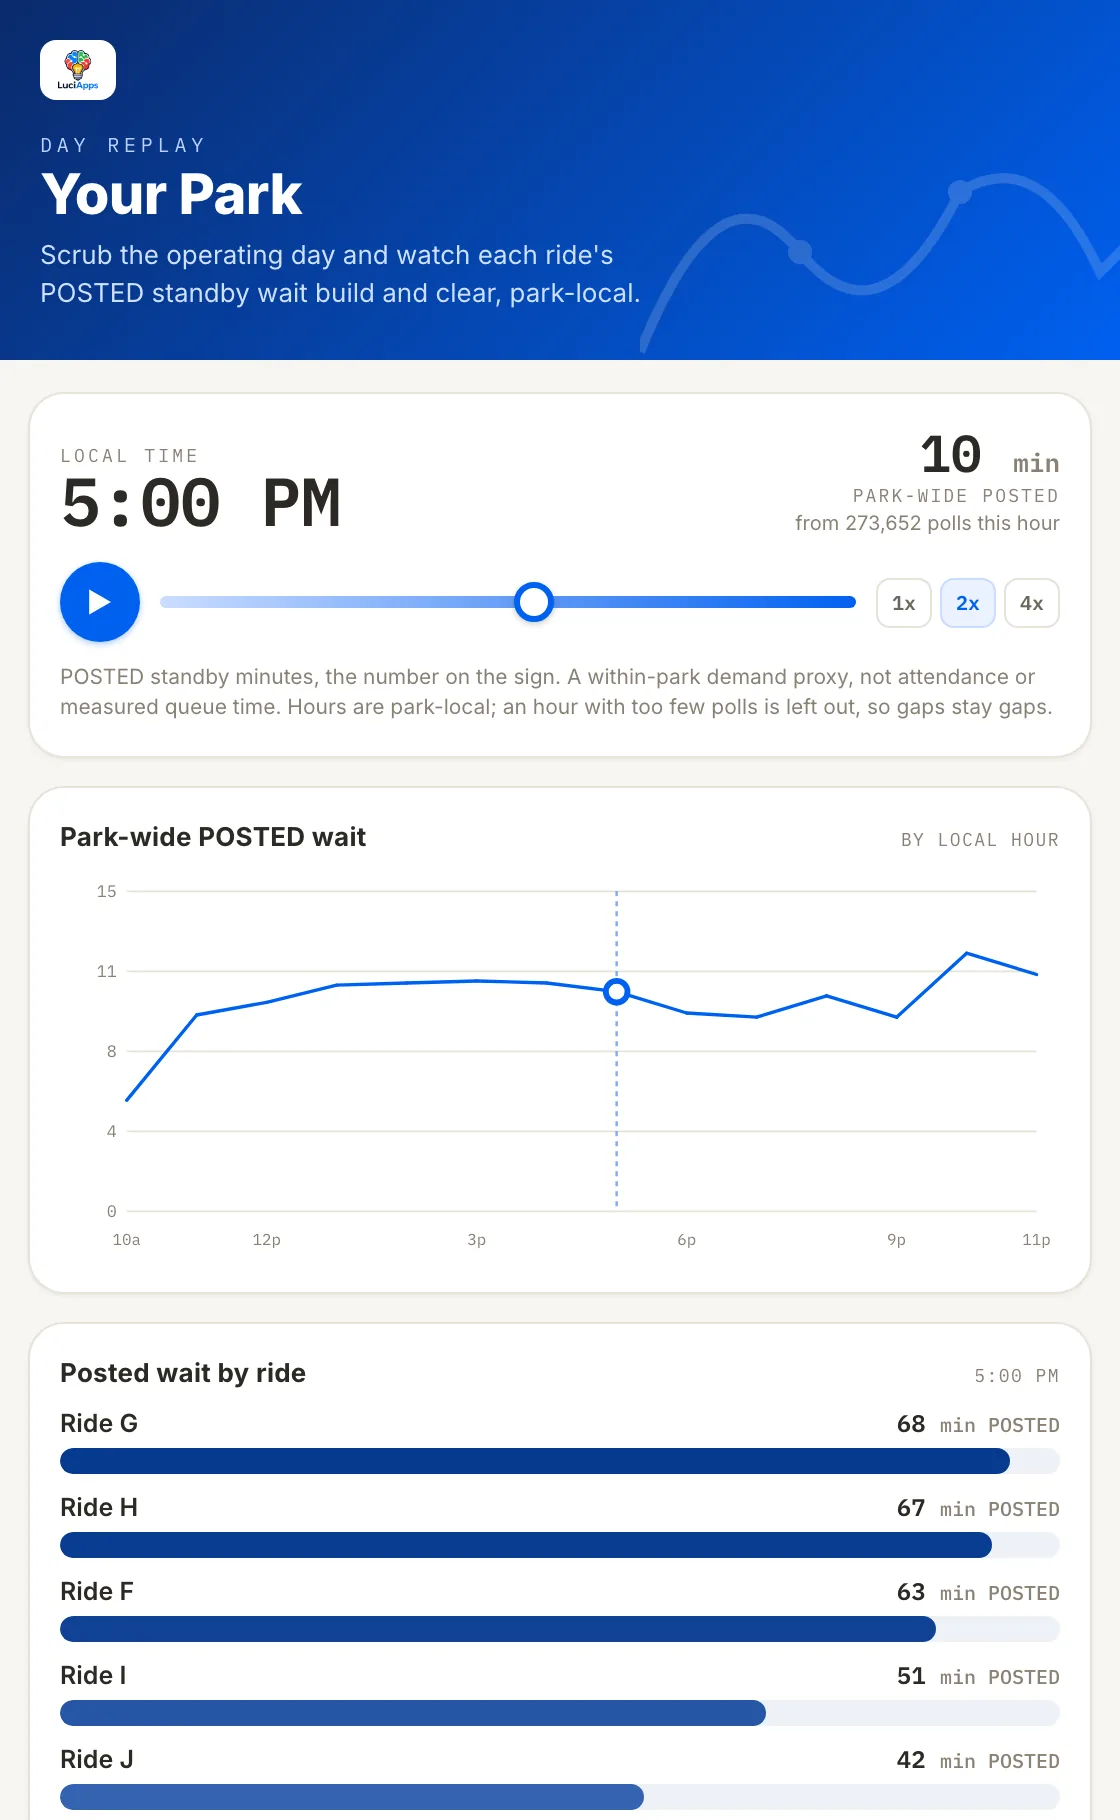
Day Replay
Scrub the operating day and watch each ride's posted wait build and clear across the park, hour by hour.
Hours with too few readings are left out, so gaps stay gaps.
Breakdowns, separated from bad weather.
Mechanical stops only. Weather and park-wide closures are removed before anything is scored.
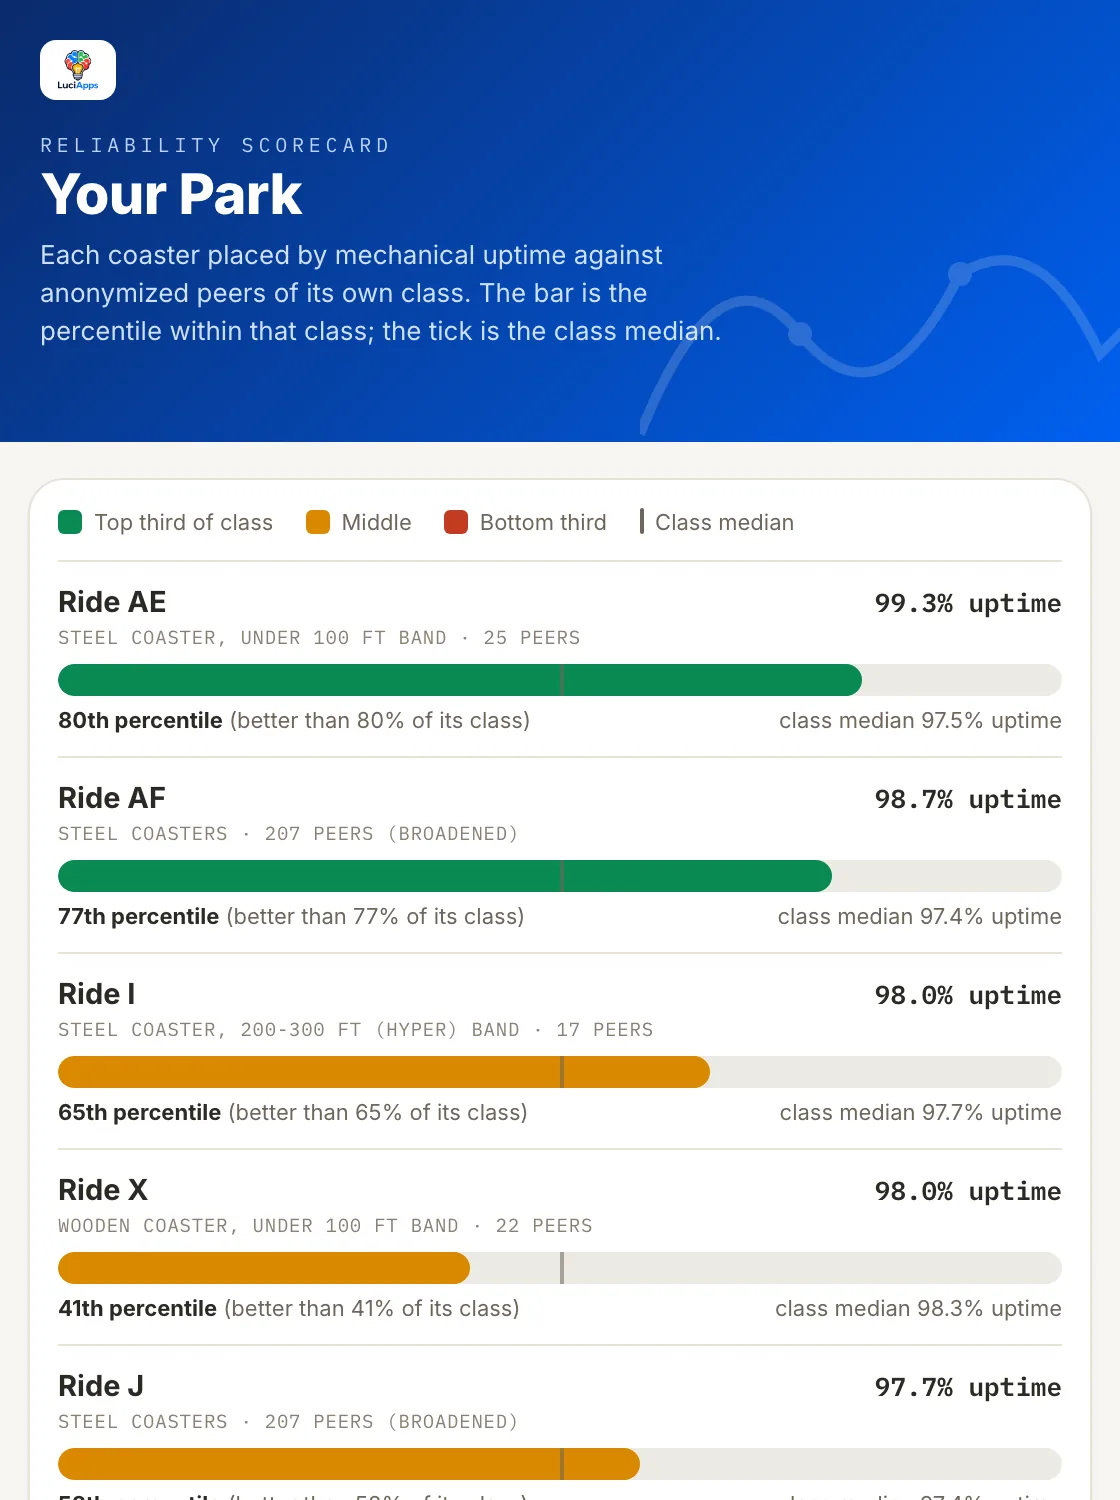
Reliability Scorecard
Each coaster's mechanical uptime as a percentile within its class: the same coaster type and height band at other parks, with the class median marked.
Classes come from ride specs. When a class is too small, it broadens and says so.
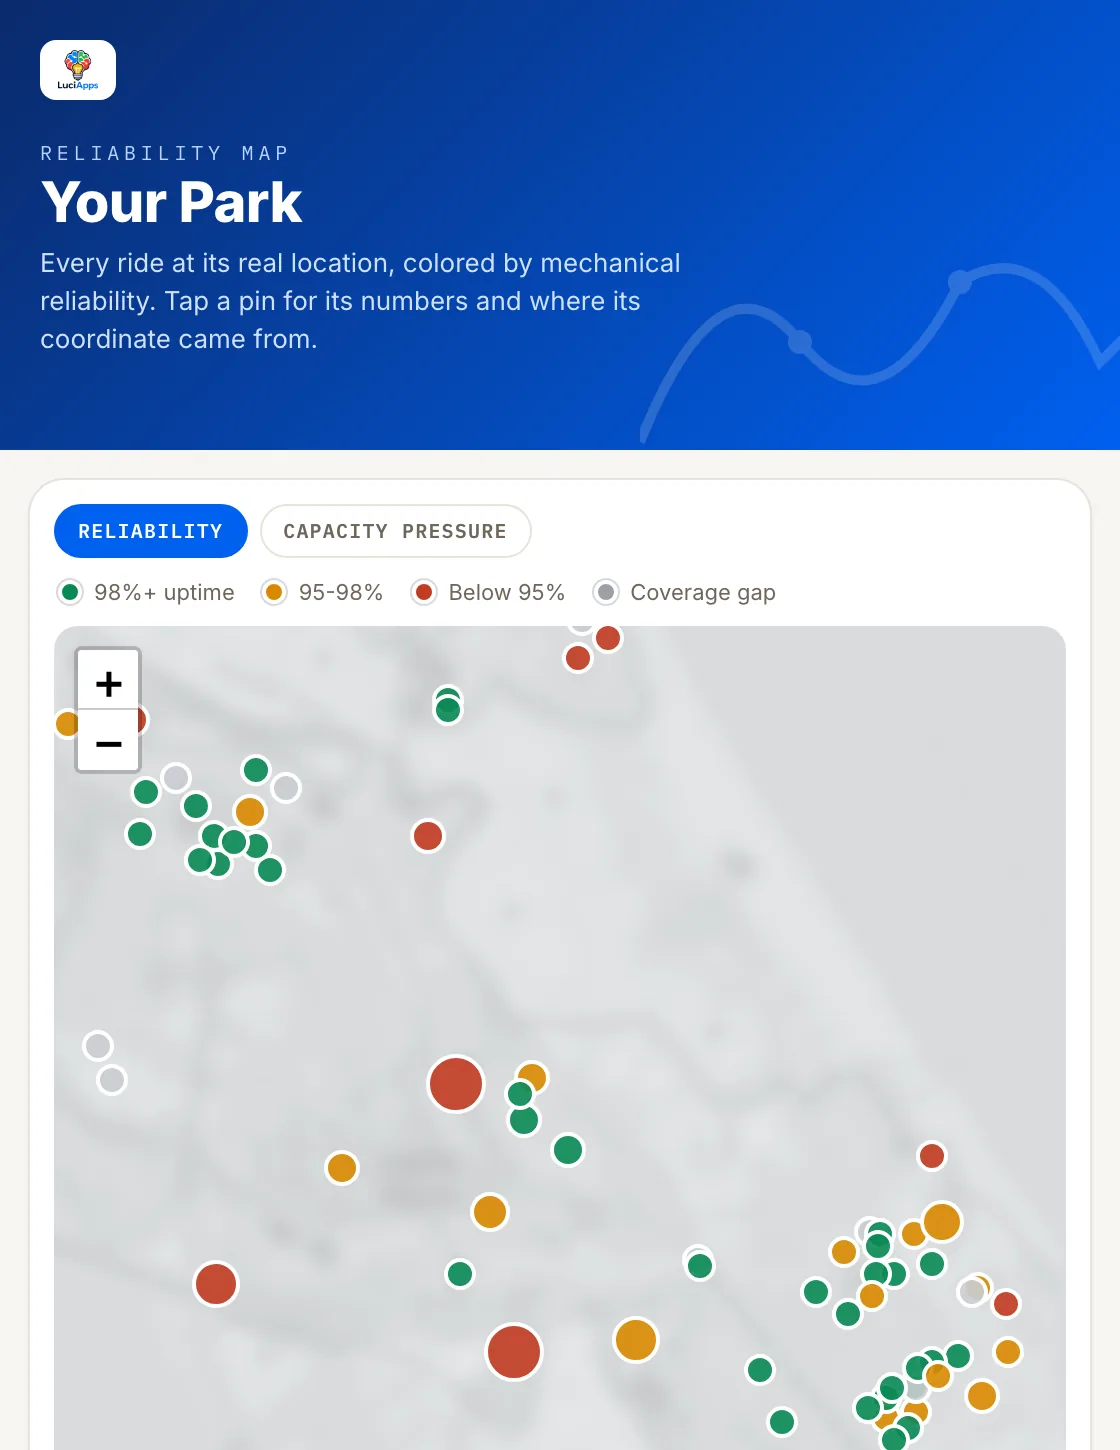
Reliability Map
Every ride at its real location, colored by mechanical reliability, with a capacity-pressure view one tap away.
Ride positions are cross-checked across several sources and flagged when they disagree.
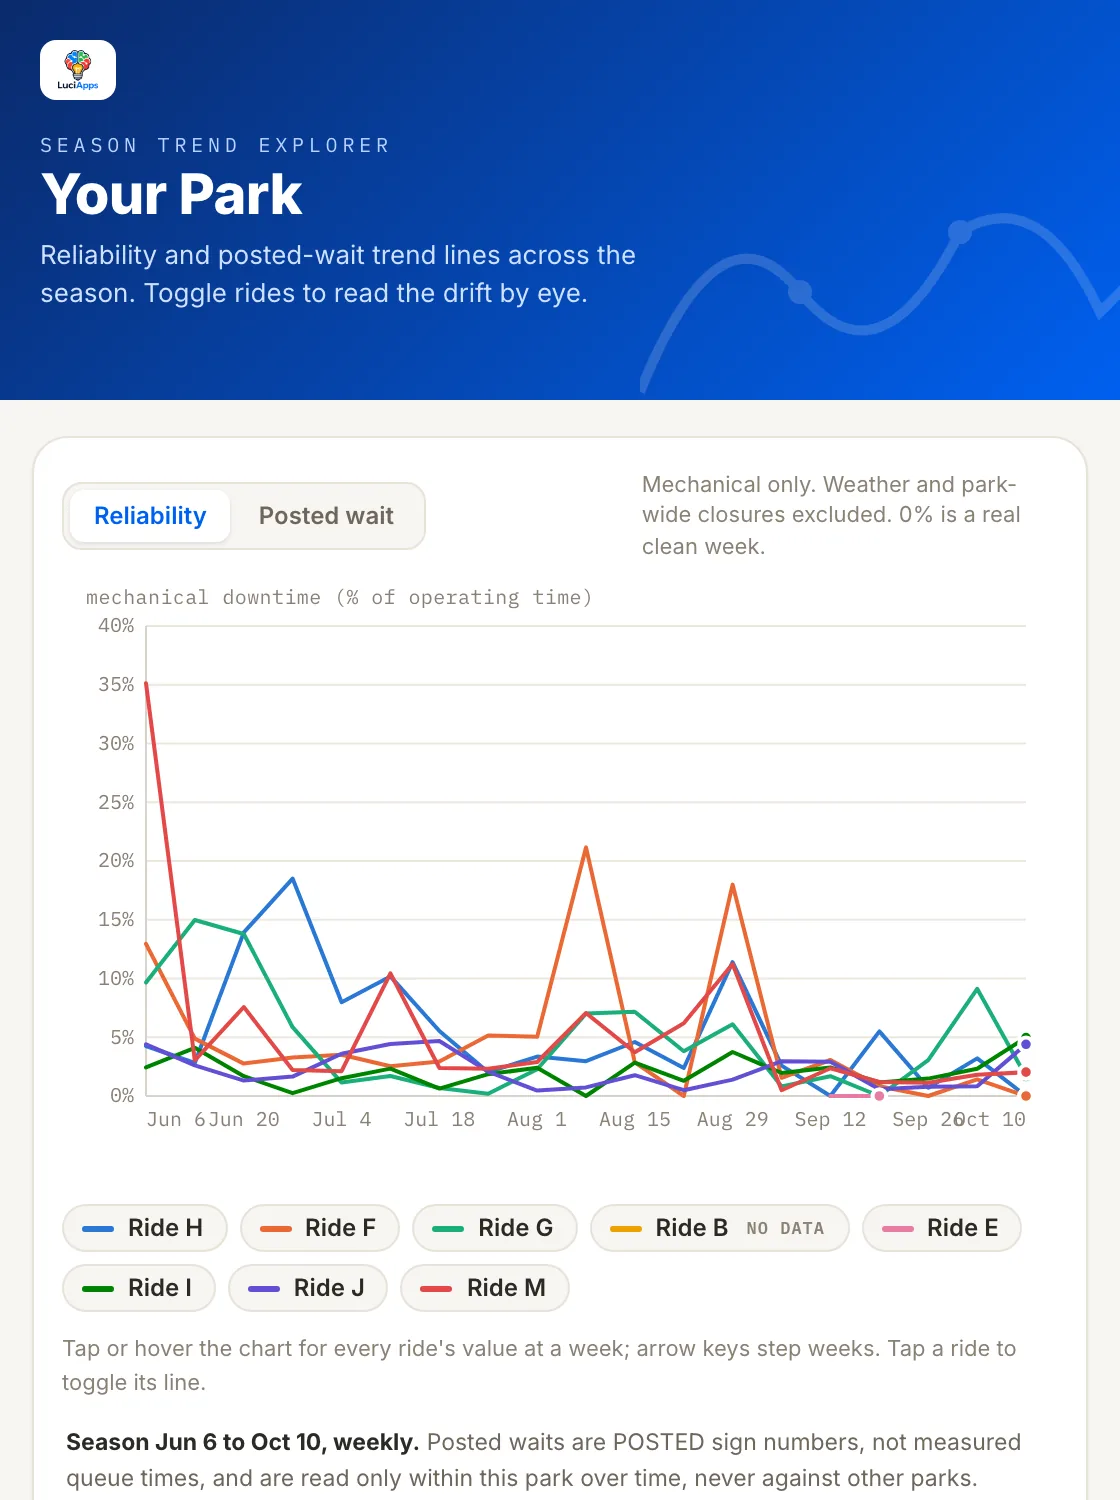
Season Trends
Reliability and posted-wait trend lines across the season. Toggle rides and read the drift by eye.
Weeks with no data are left as gaps in the line, not filled in.
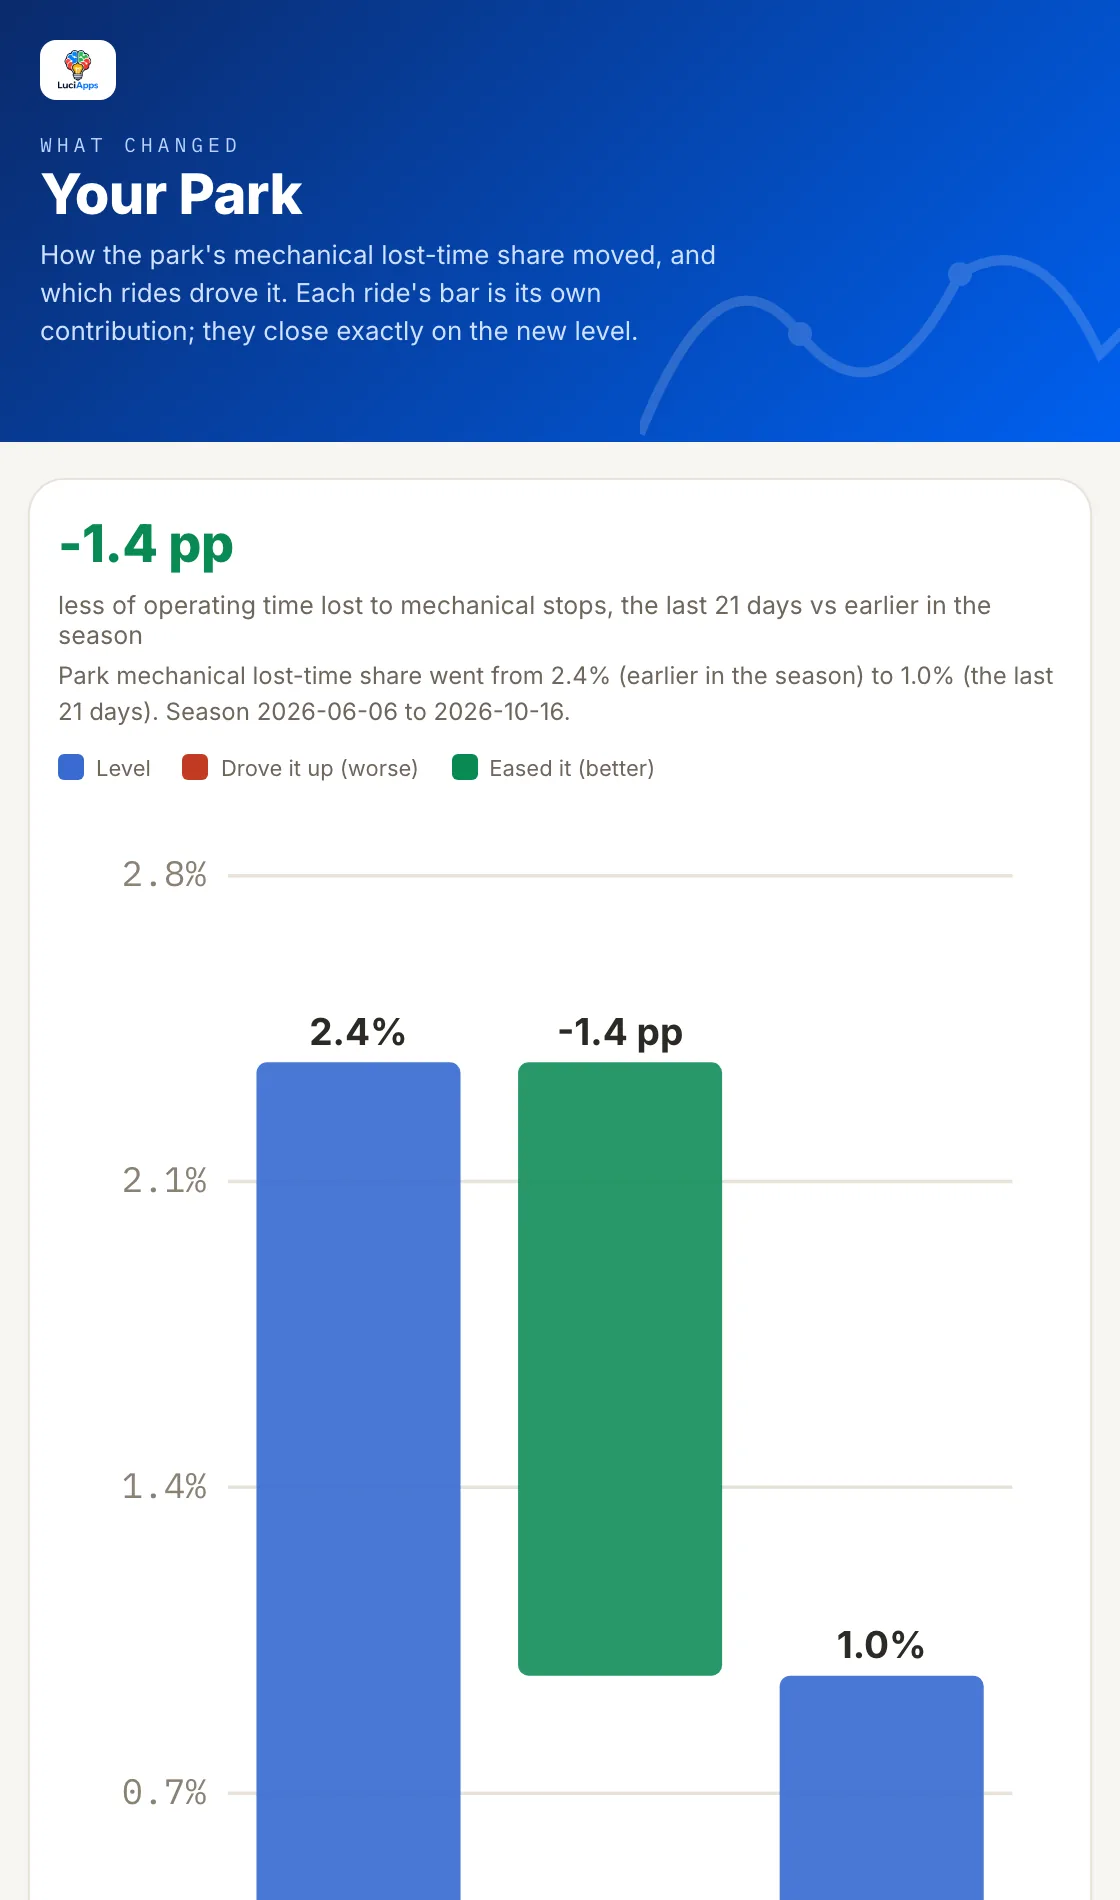
What Changed
Splits a change in lost operating time into each ride's contribution, so the bars add up exactly to the new level.
When no single ride crosses the materiality gate, it says the change was broad rather than naming a culprit.
Your park against everyone, with no one named.
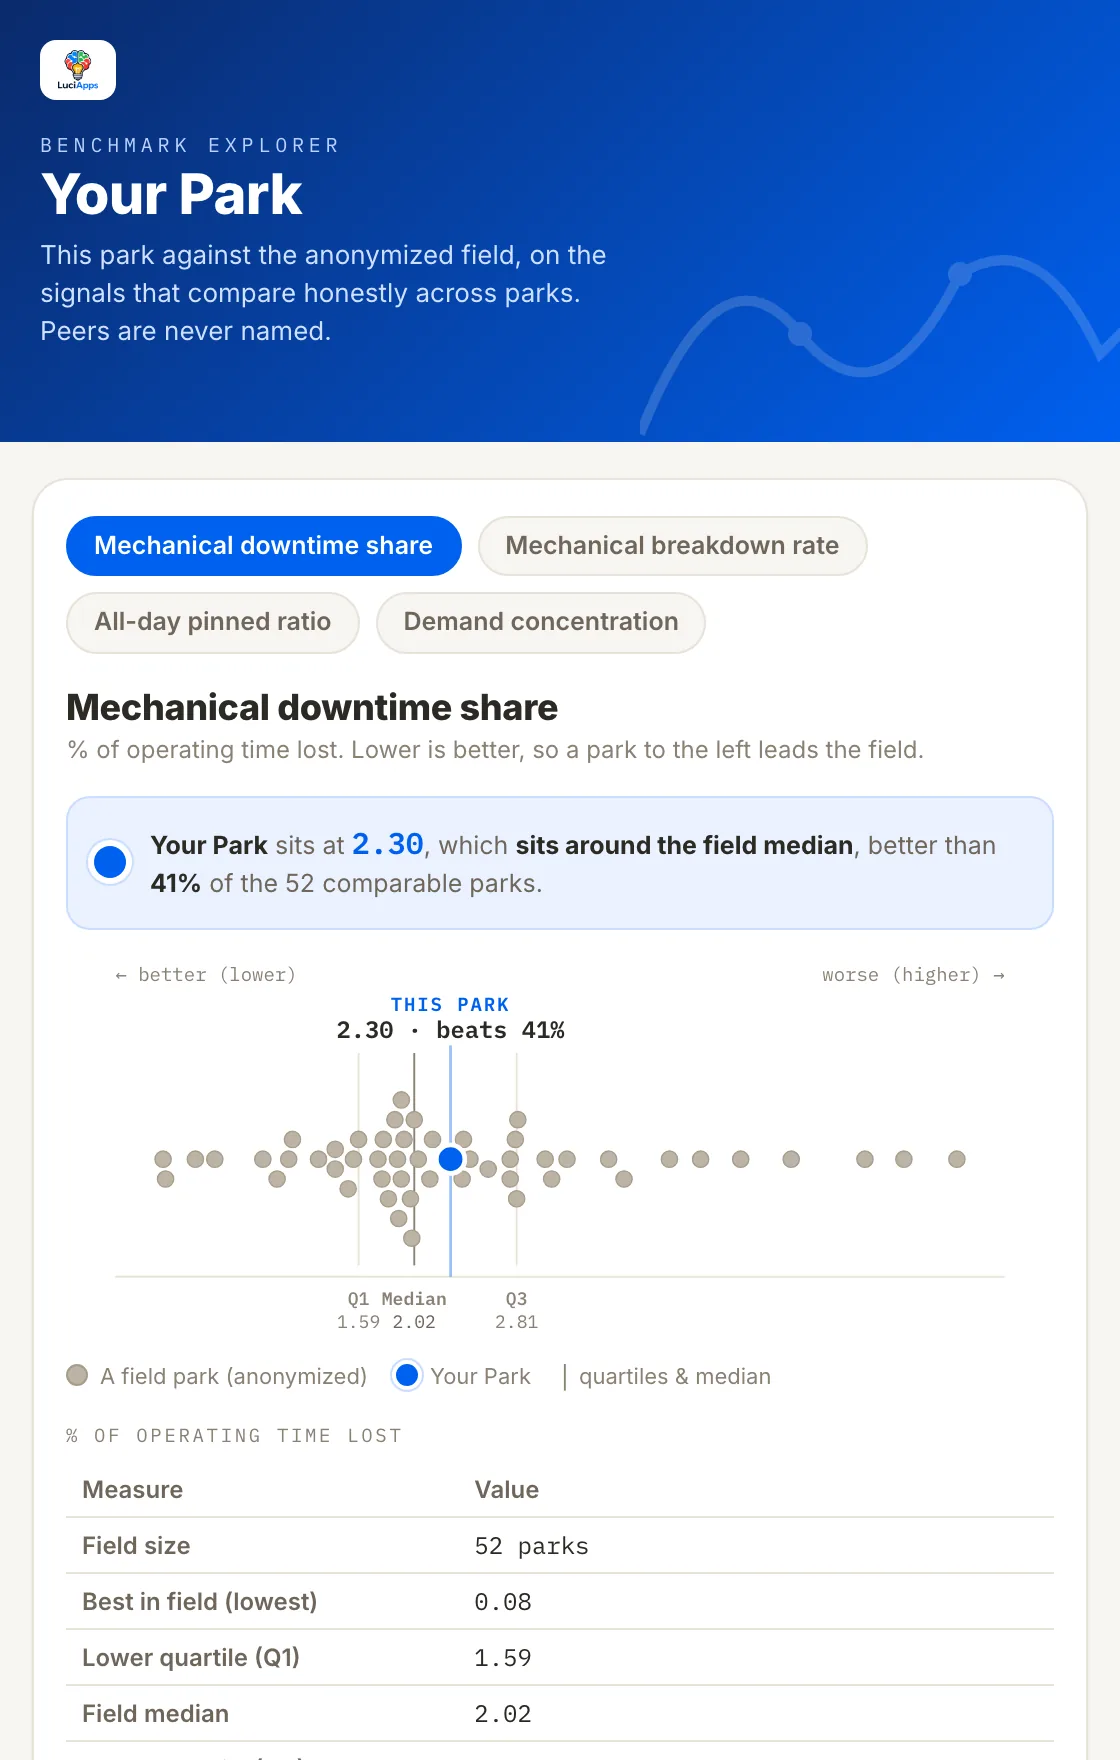
Only signals that compare honestly across parks are benchmarked: mechanical reliability, breakdown rate, pinned ratio and demand concentration.
Field Benchmark
Your park as one marked dot in the anonymized field for each signal, with quartiles, the median and your exact standing.
Posted-wait levels are never compared across parks. The field is anonymized; only your park is named.
Peer Groups
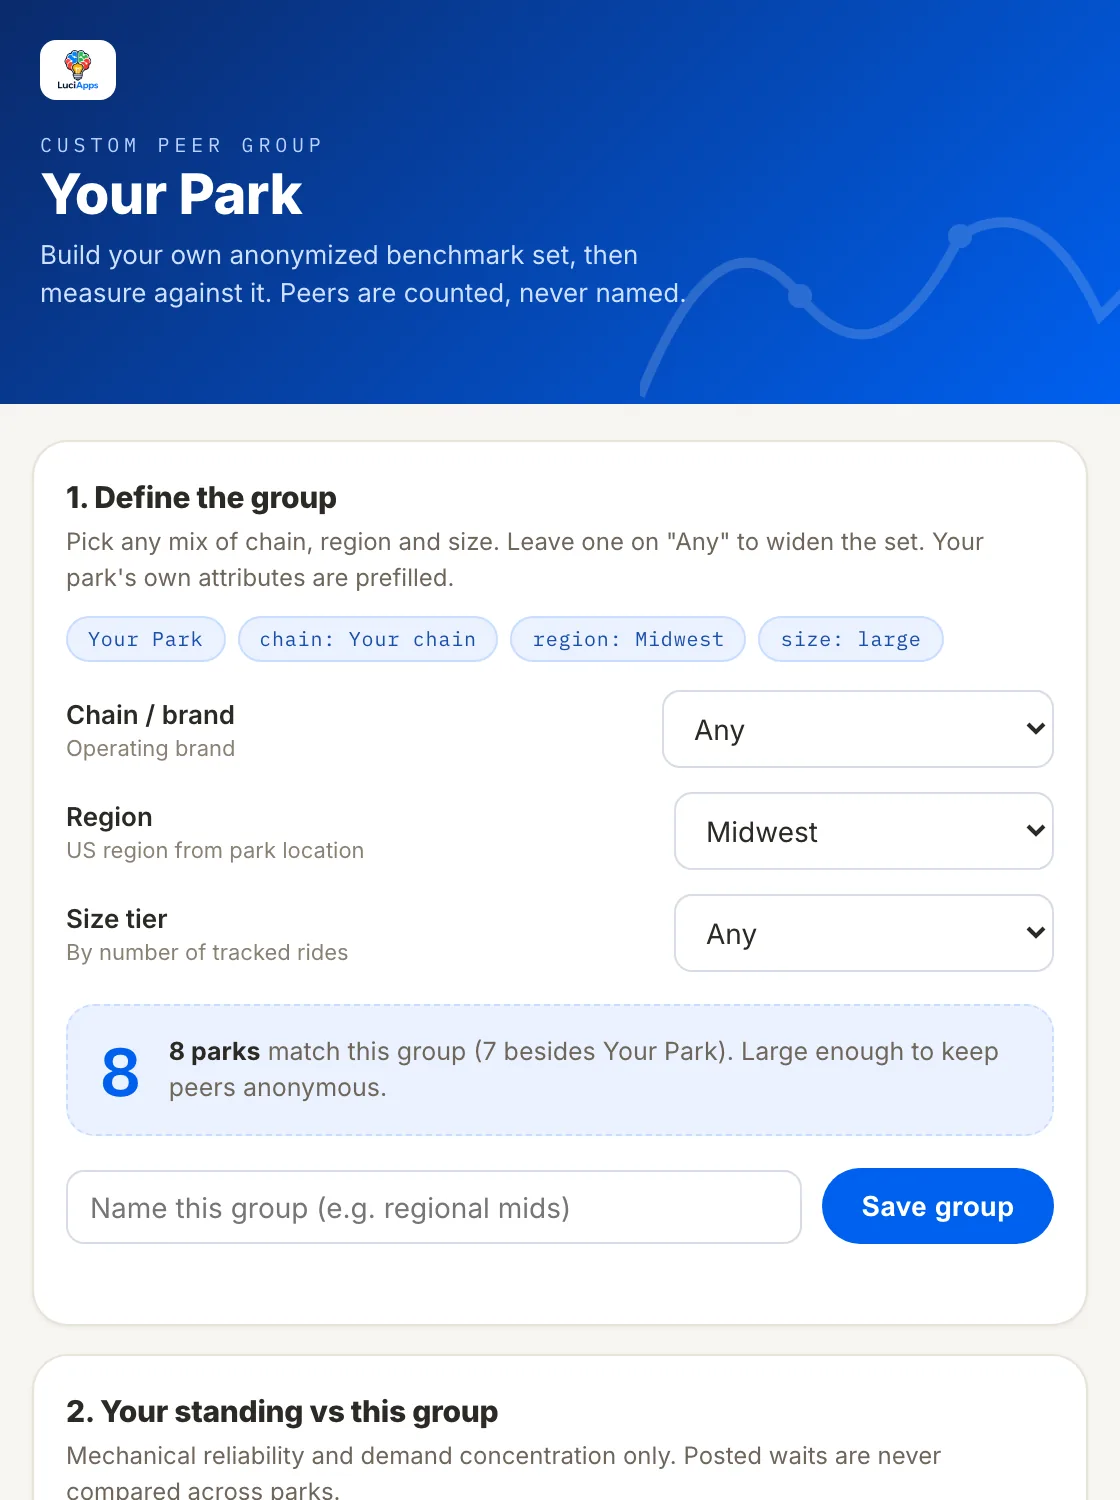
Build your own benchmark set by chain, region and size, then measure against it.
A group must be large enough to keep its members anonymous before it shows any result.
Test the decision before you pay for it.
Scenarios run on your park's own measured inputs, with every assumption shown.
Park Twin
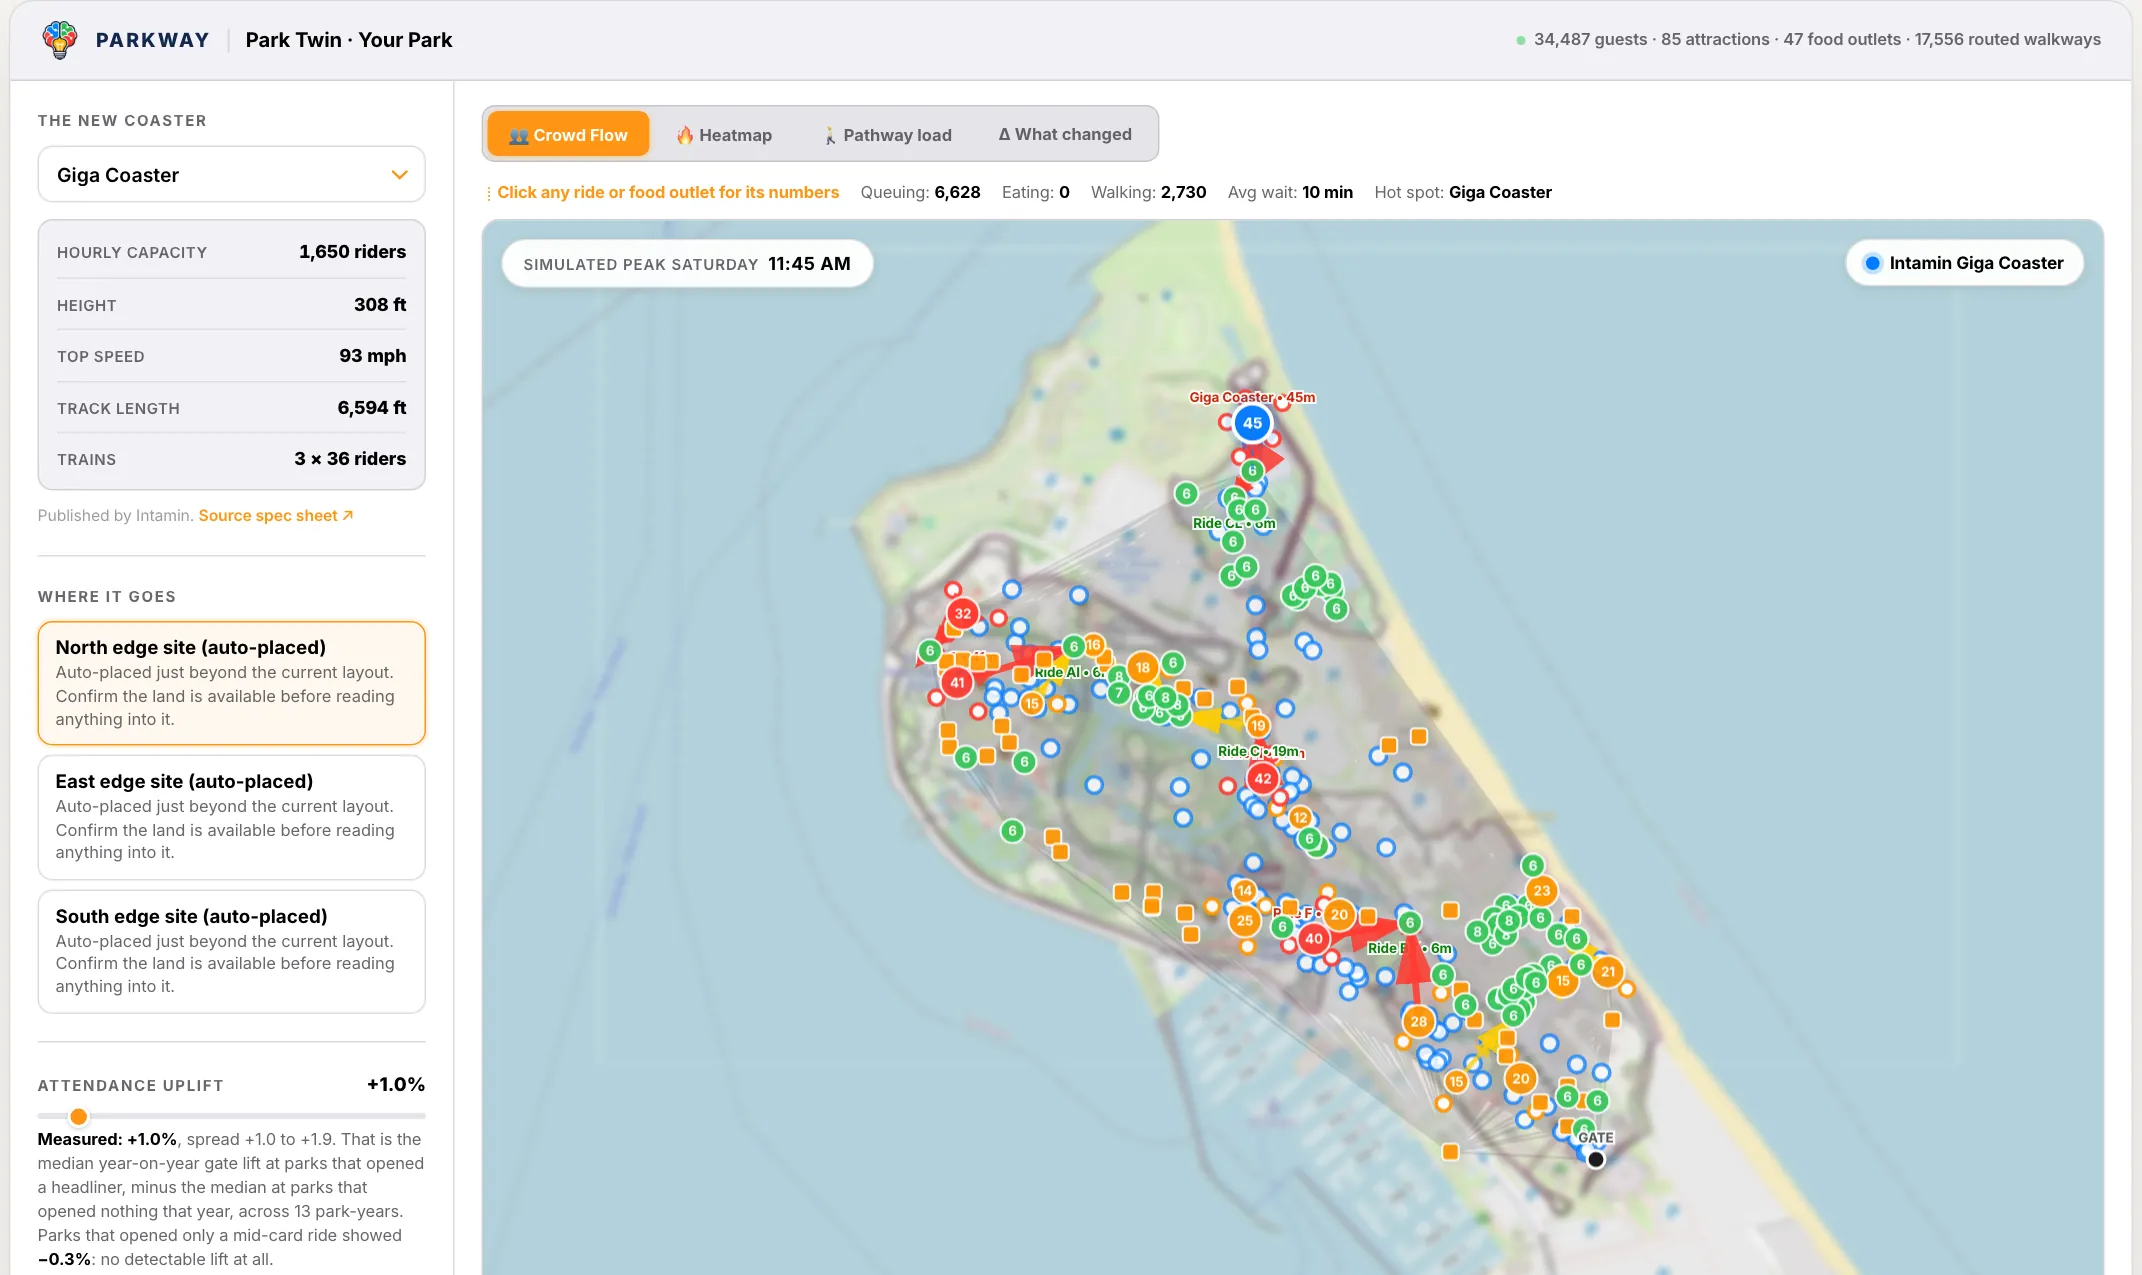
A walking simulation of the park on a peak day. Drop in a new ride from a real spec sheet and watch where guests move, which paths load up and what changes.
Measured attendance lift from a new headliner is shown as measured: about one percent, with its spread. It is not inflated to sell the ride.
Closure Scenario
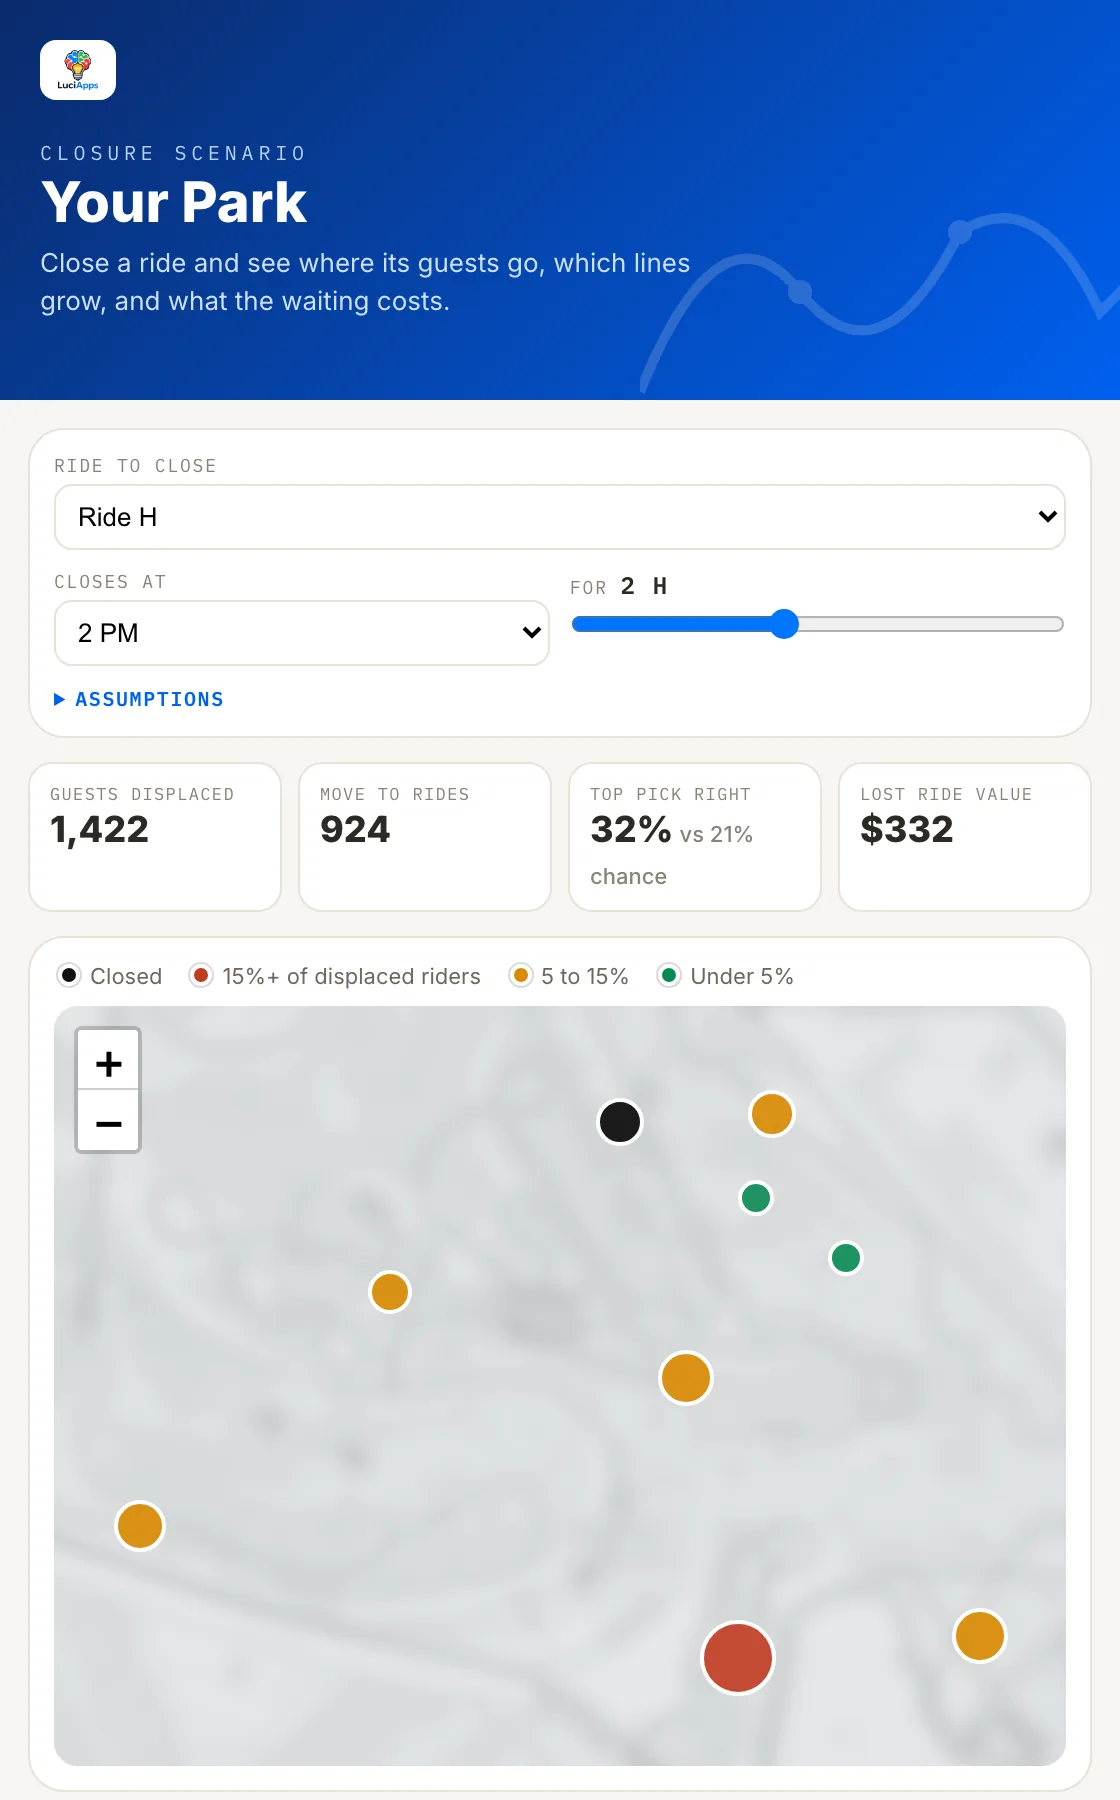
Close a ride at a given hour and see how many guests it displaces, where they go, which lines grow and what the lost ride time is worth.
Tested on 2,158 real unplanned breakdowns at 27 parks.
Capex Planner
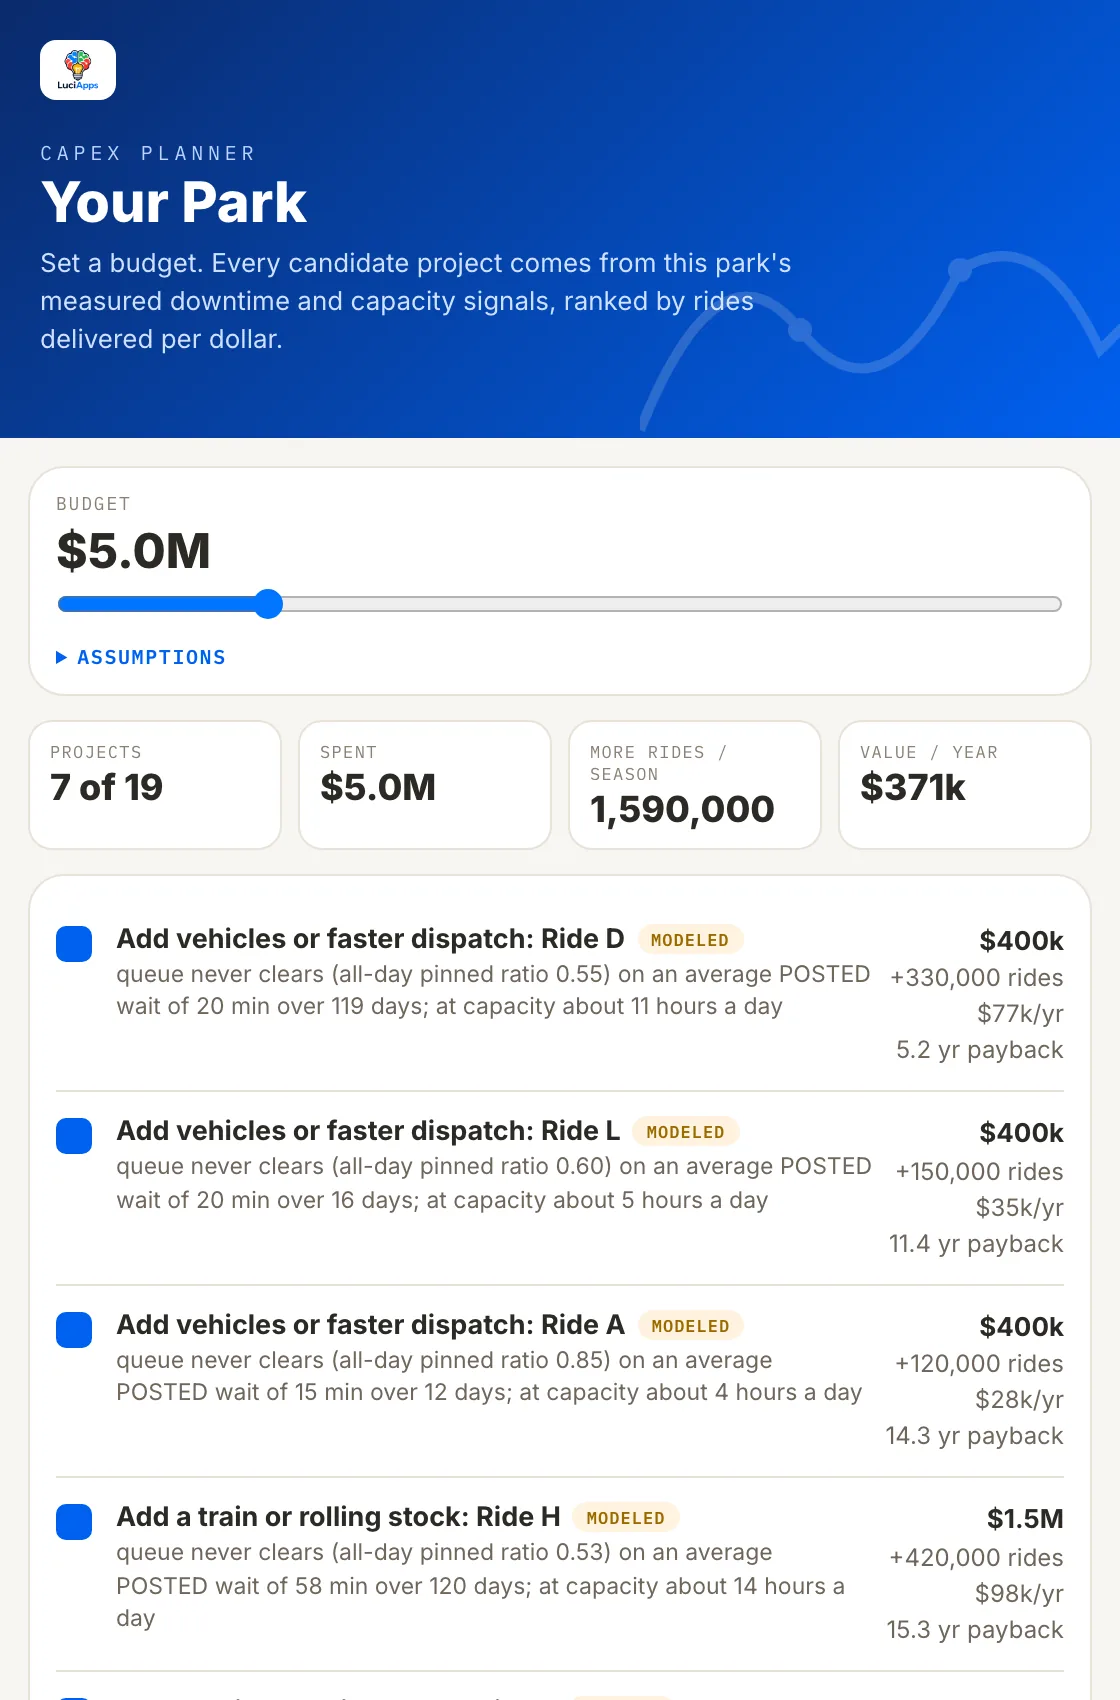
Set a budget and get candidate projects drawn from your park's measured downtime and capacity signals, ranked by rides delivered per dollar, with payback.
Each project is labeled modeled or measured, and the assumptions are one tap away.
Corporate portfolio
A chain sees its own parks side by side on the same scores and screens. It never sees another operator's parks.
Reliability by model
Mechanical reliability by ride model across parks, built from the same rules. Available by arrangement.
Every screen you just saw, on your park.
Tell us your park and we will open these screens on its own numbers in a thirty-minute walkthrough. Meeting at IAAPA Expo in Orlando, November 17 to 20? Say so in your note.