 Parkway for park operators
The park analyst that shows its work.
Ask about your park in plain language. Parkway answers from measured data across 61 parks, cites every figure, ranks you against peers it never names, and tells you plainly when it cannot answer.
Needs nothing from your systems to start. Connect them later and estimates become exact.
Answers you can check, from an analyst that knows its limits.
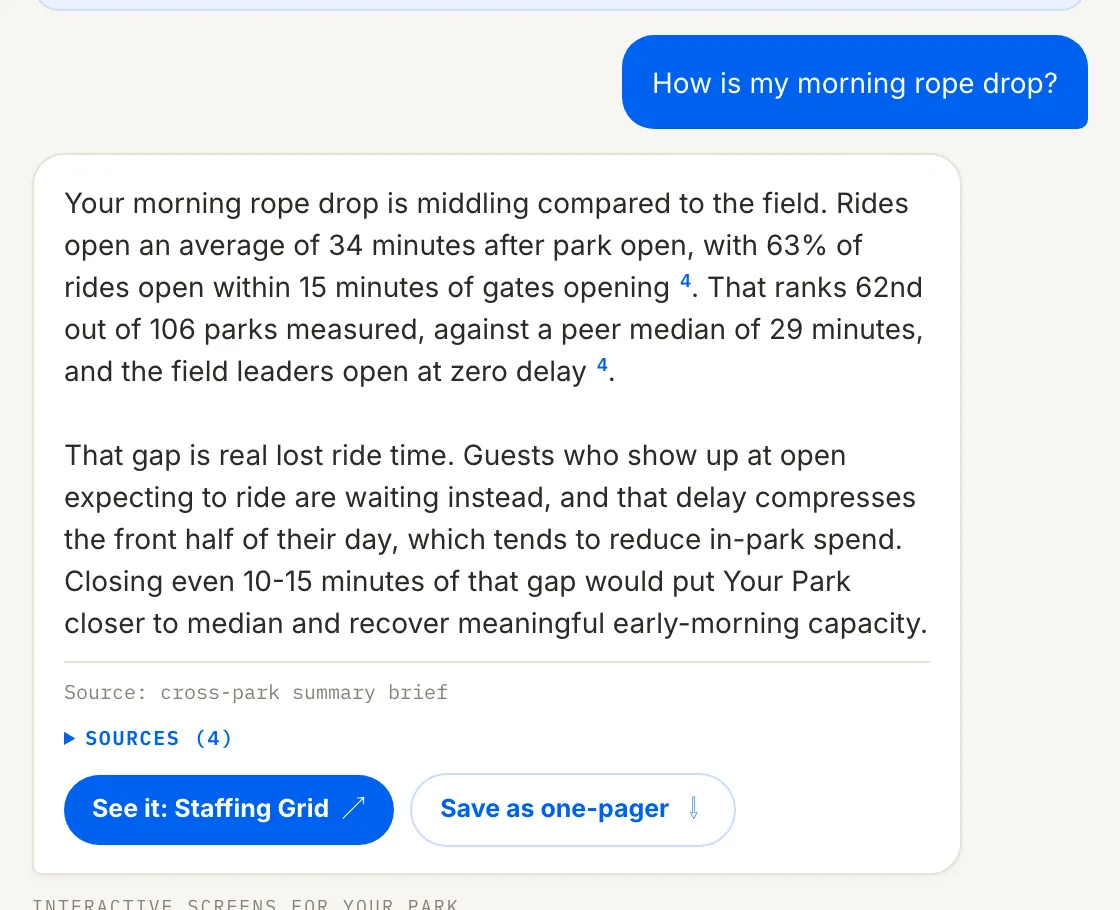
Every response is built from queries run that session. Each figure carries a numbered source, the caveats travel with the answer, and the matching screen is one tap away.
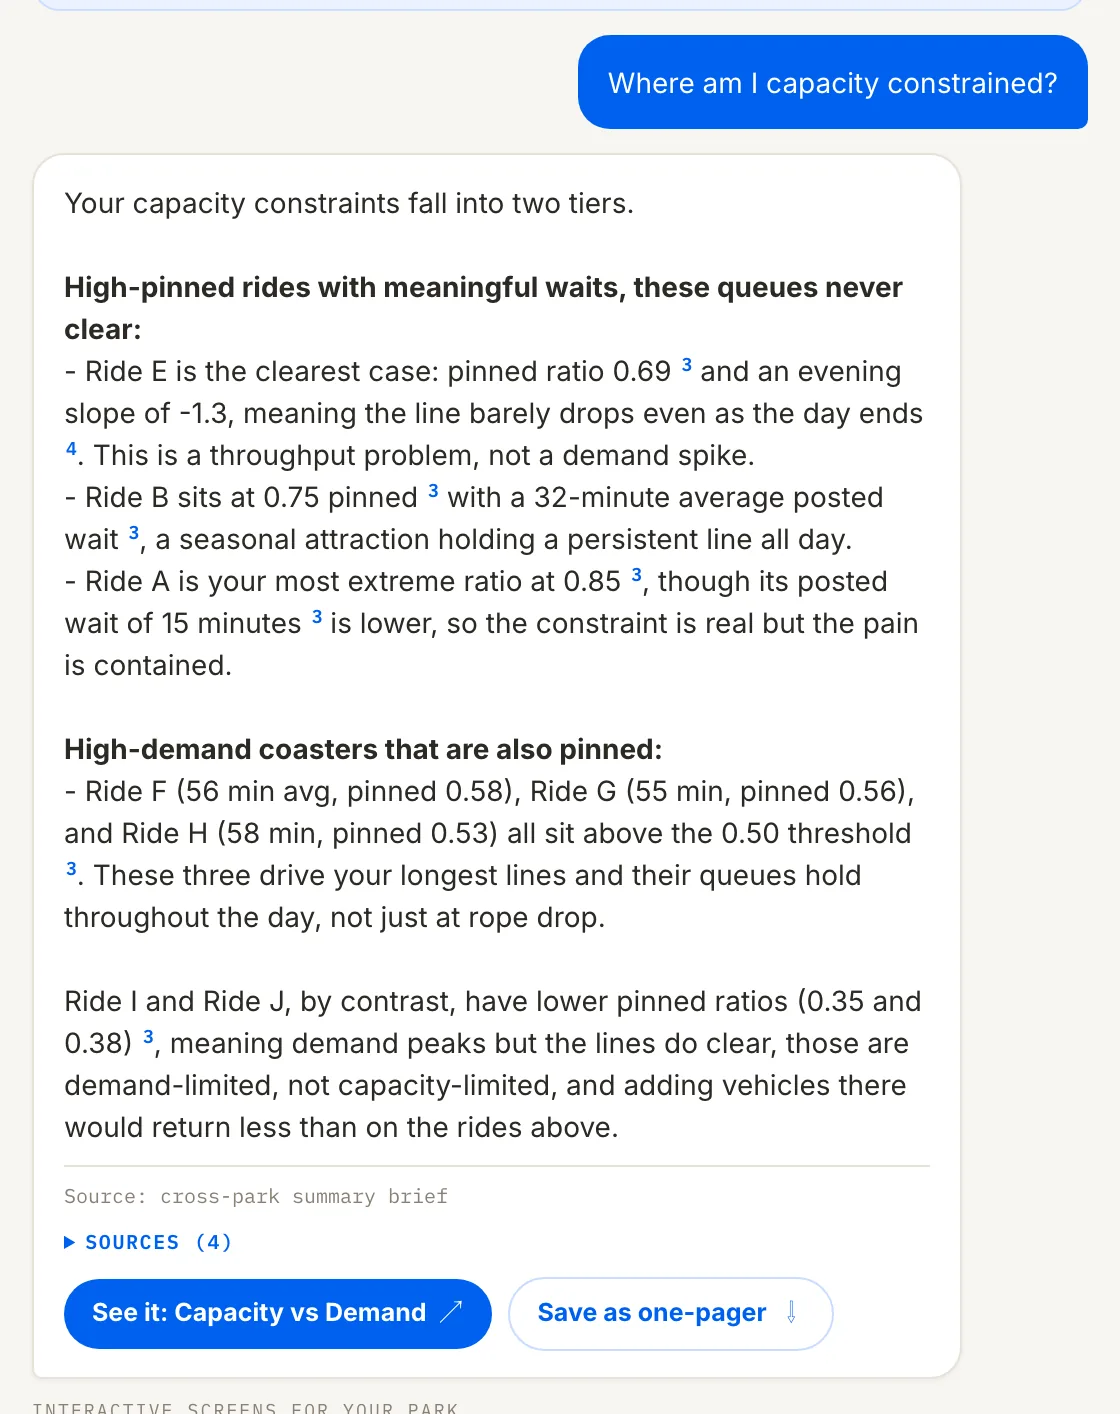
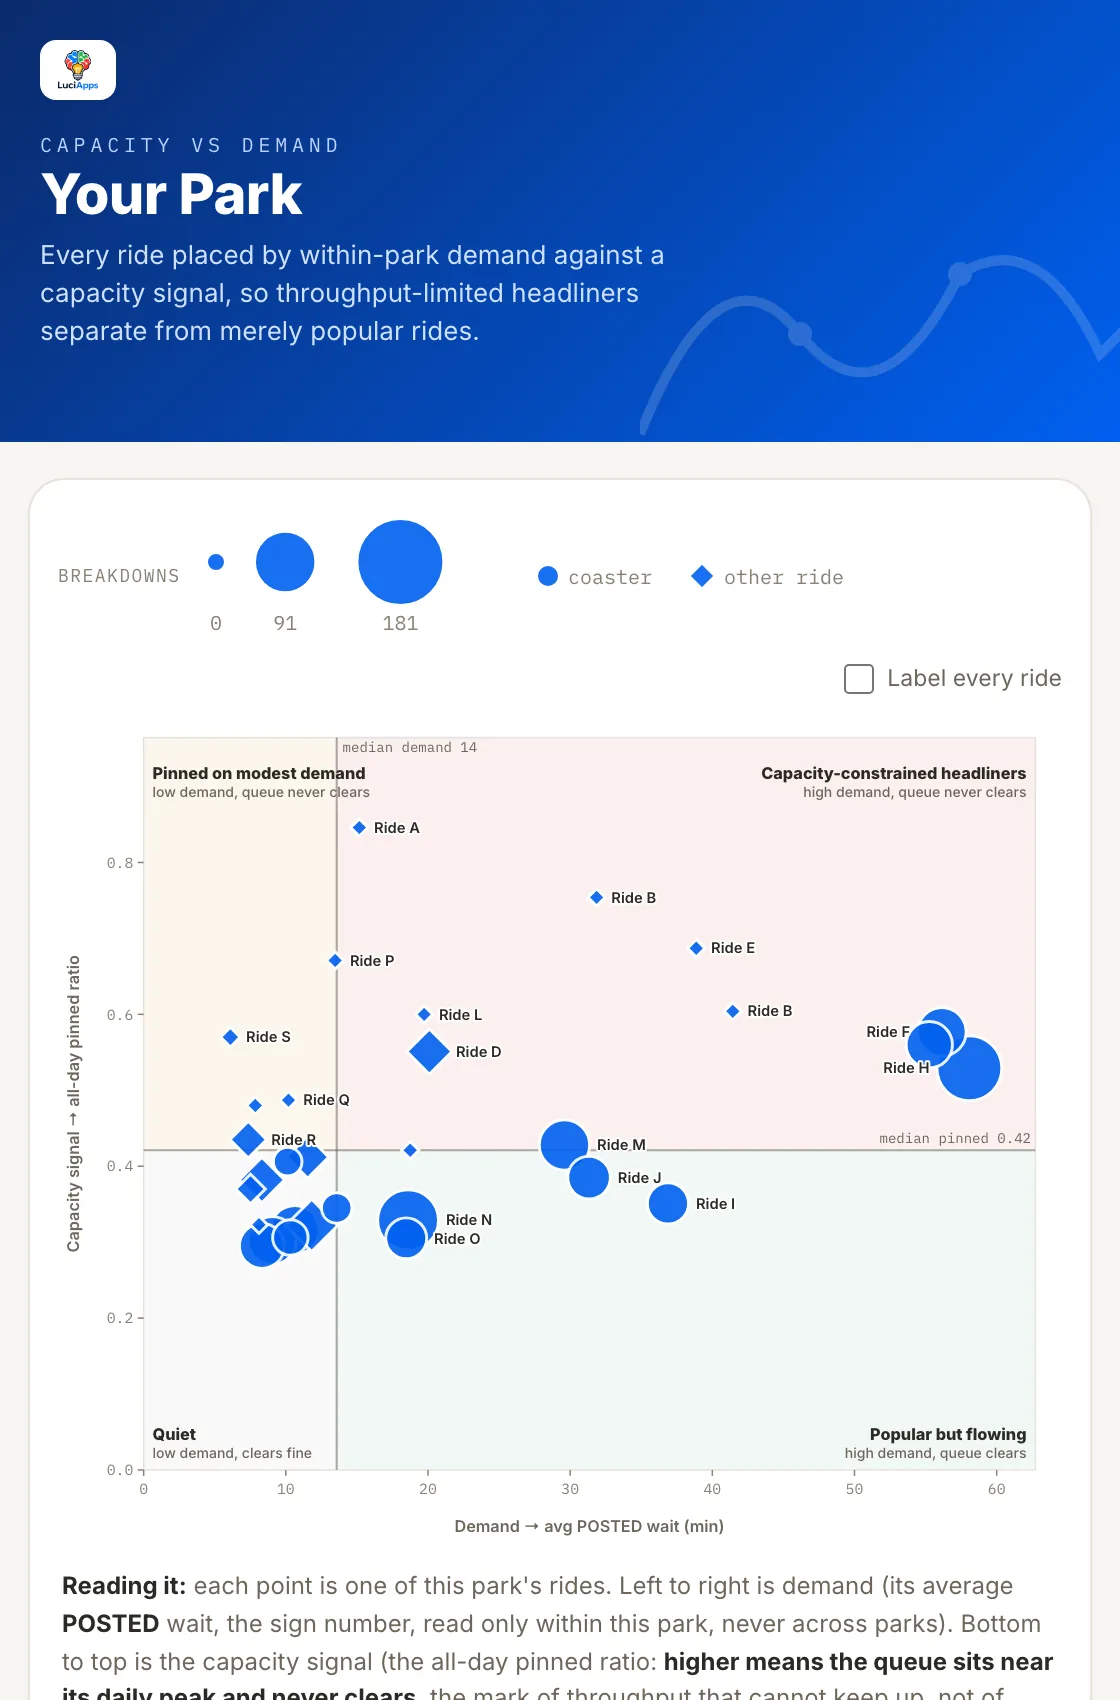
It finds the ride that limits your throughput.
The all-day pinned ratio separates a queue that never clears from one that spikes and recovers. Added capacity helps the first. It does little for the second.
It ranks you against peers it never names.
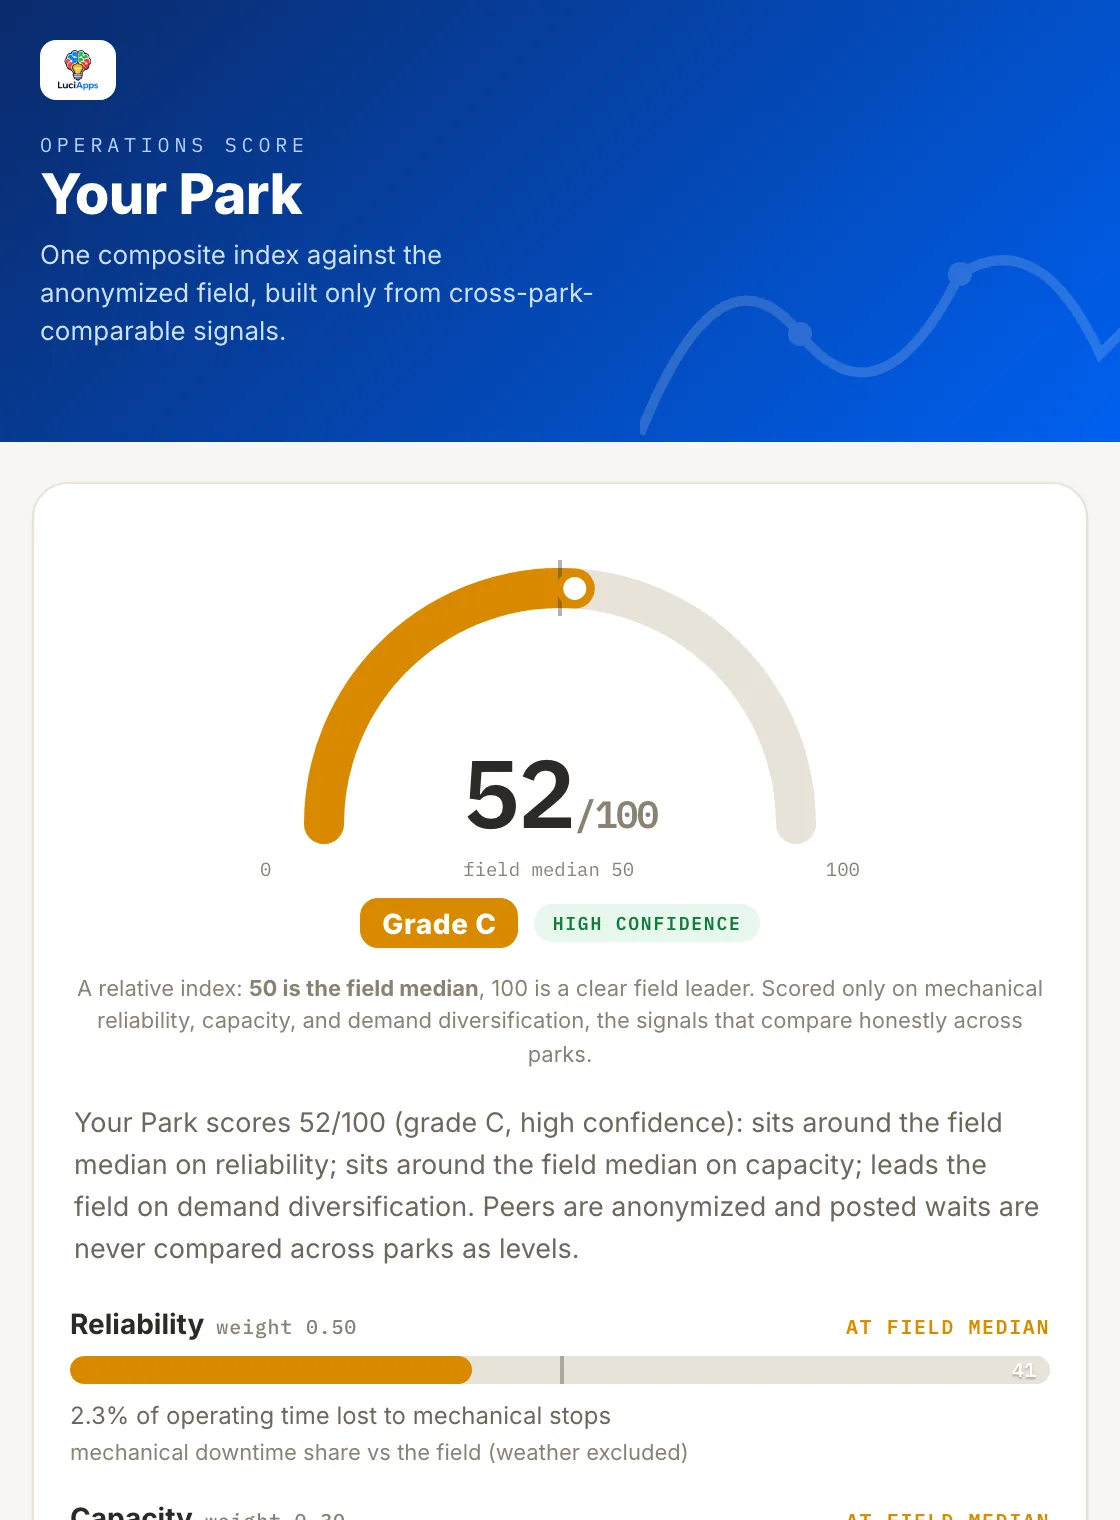
Rope-drop speed, reliability and demand spread are compared with the anonymized field. You see your rank and the spread, never another park's name.
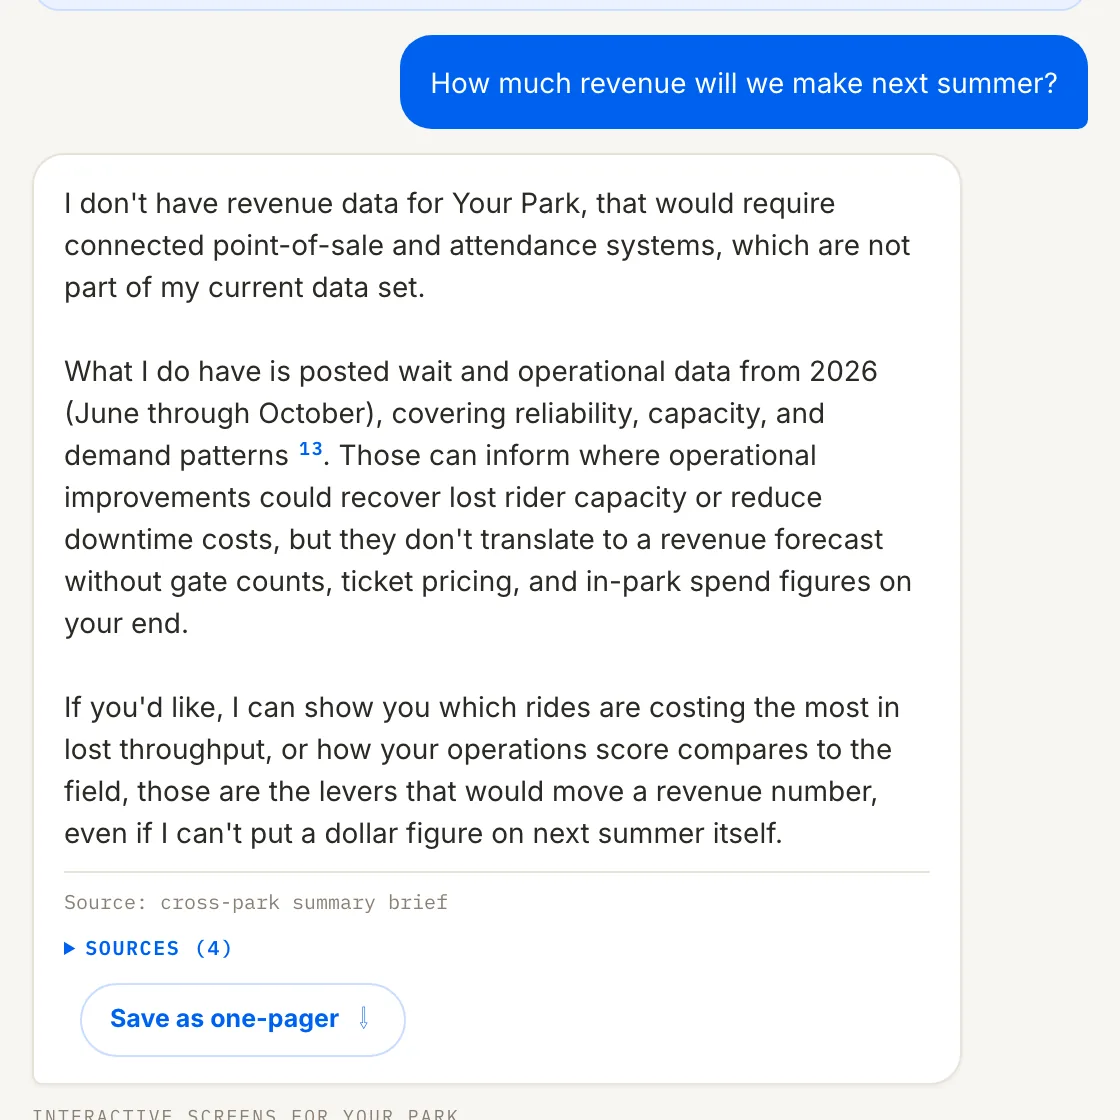
It tells you where its knowledge stops.
Asked to forecast next summer's revenue, it says it does not have the data for that, names what would be needed, then offers what it can measure.
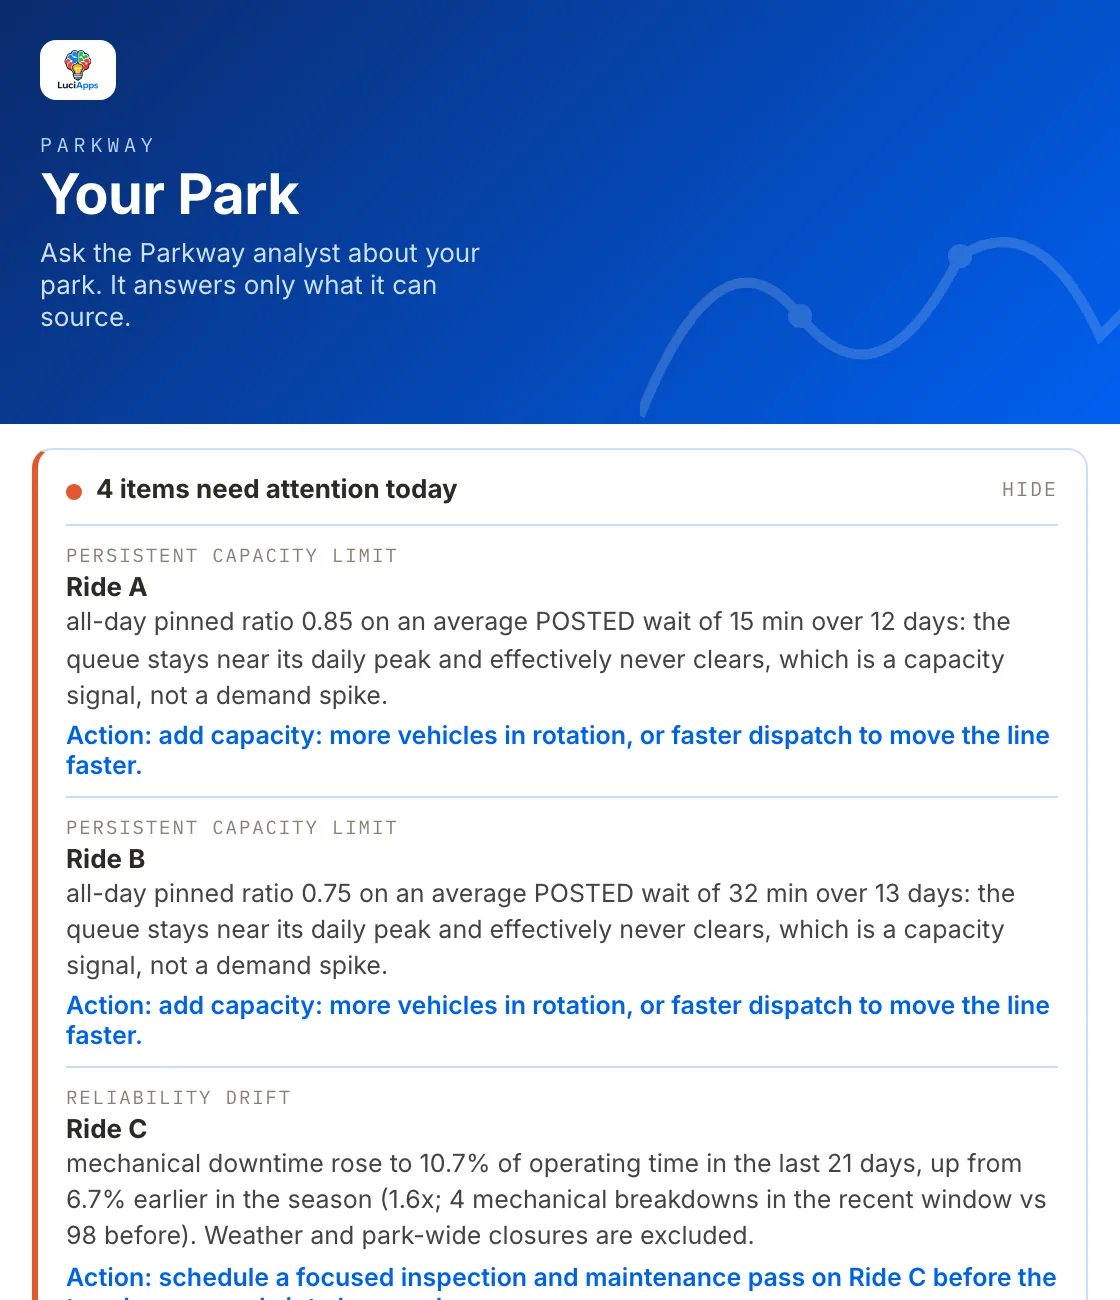
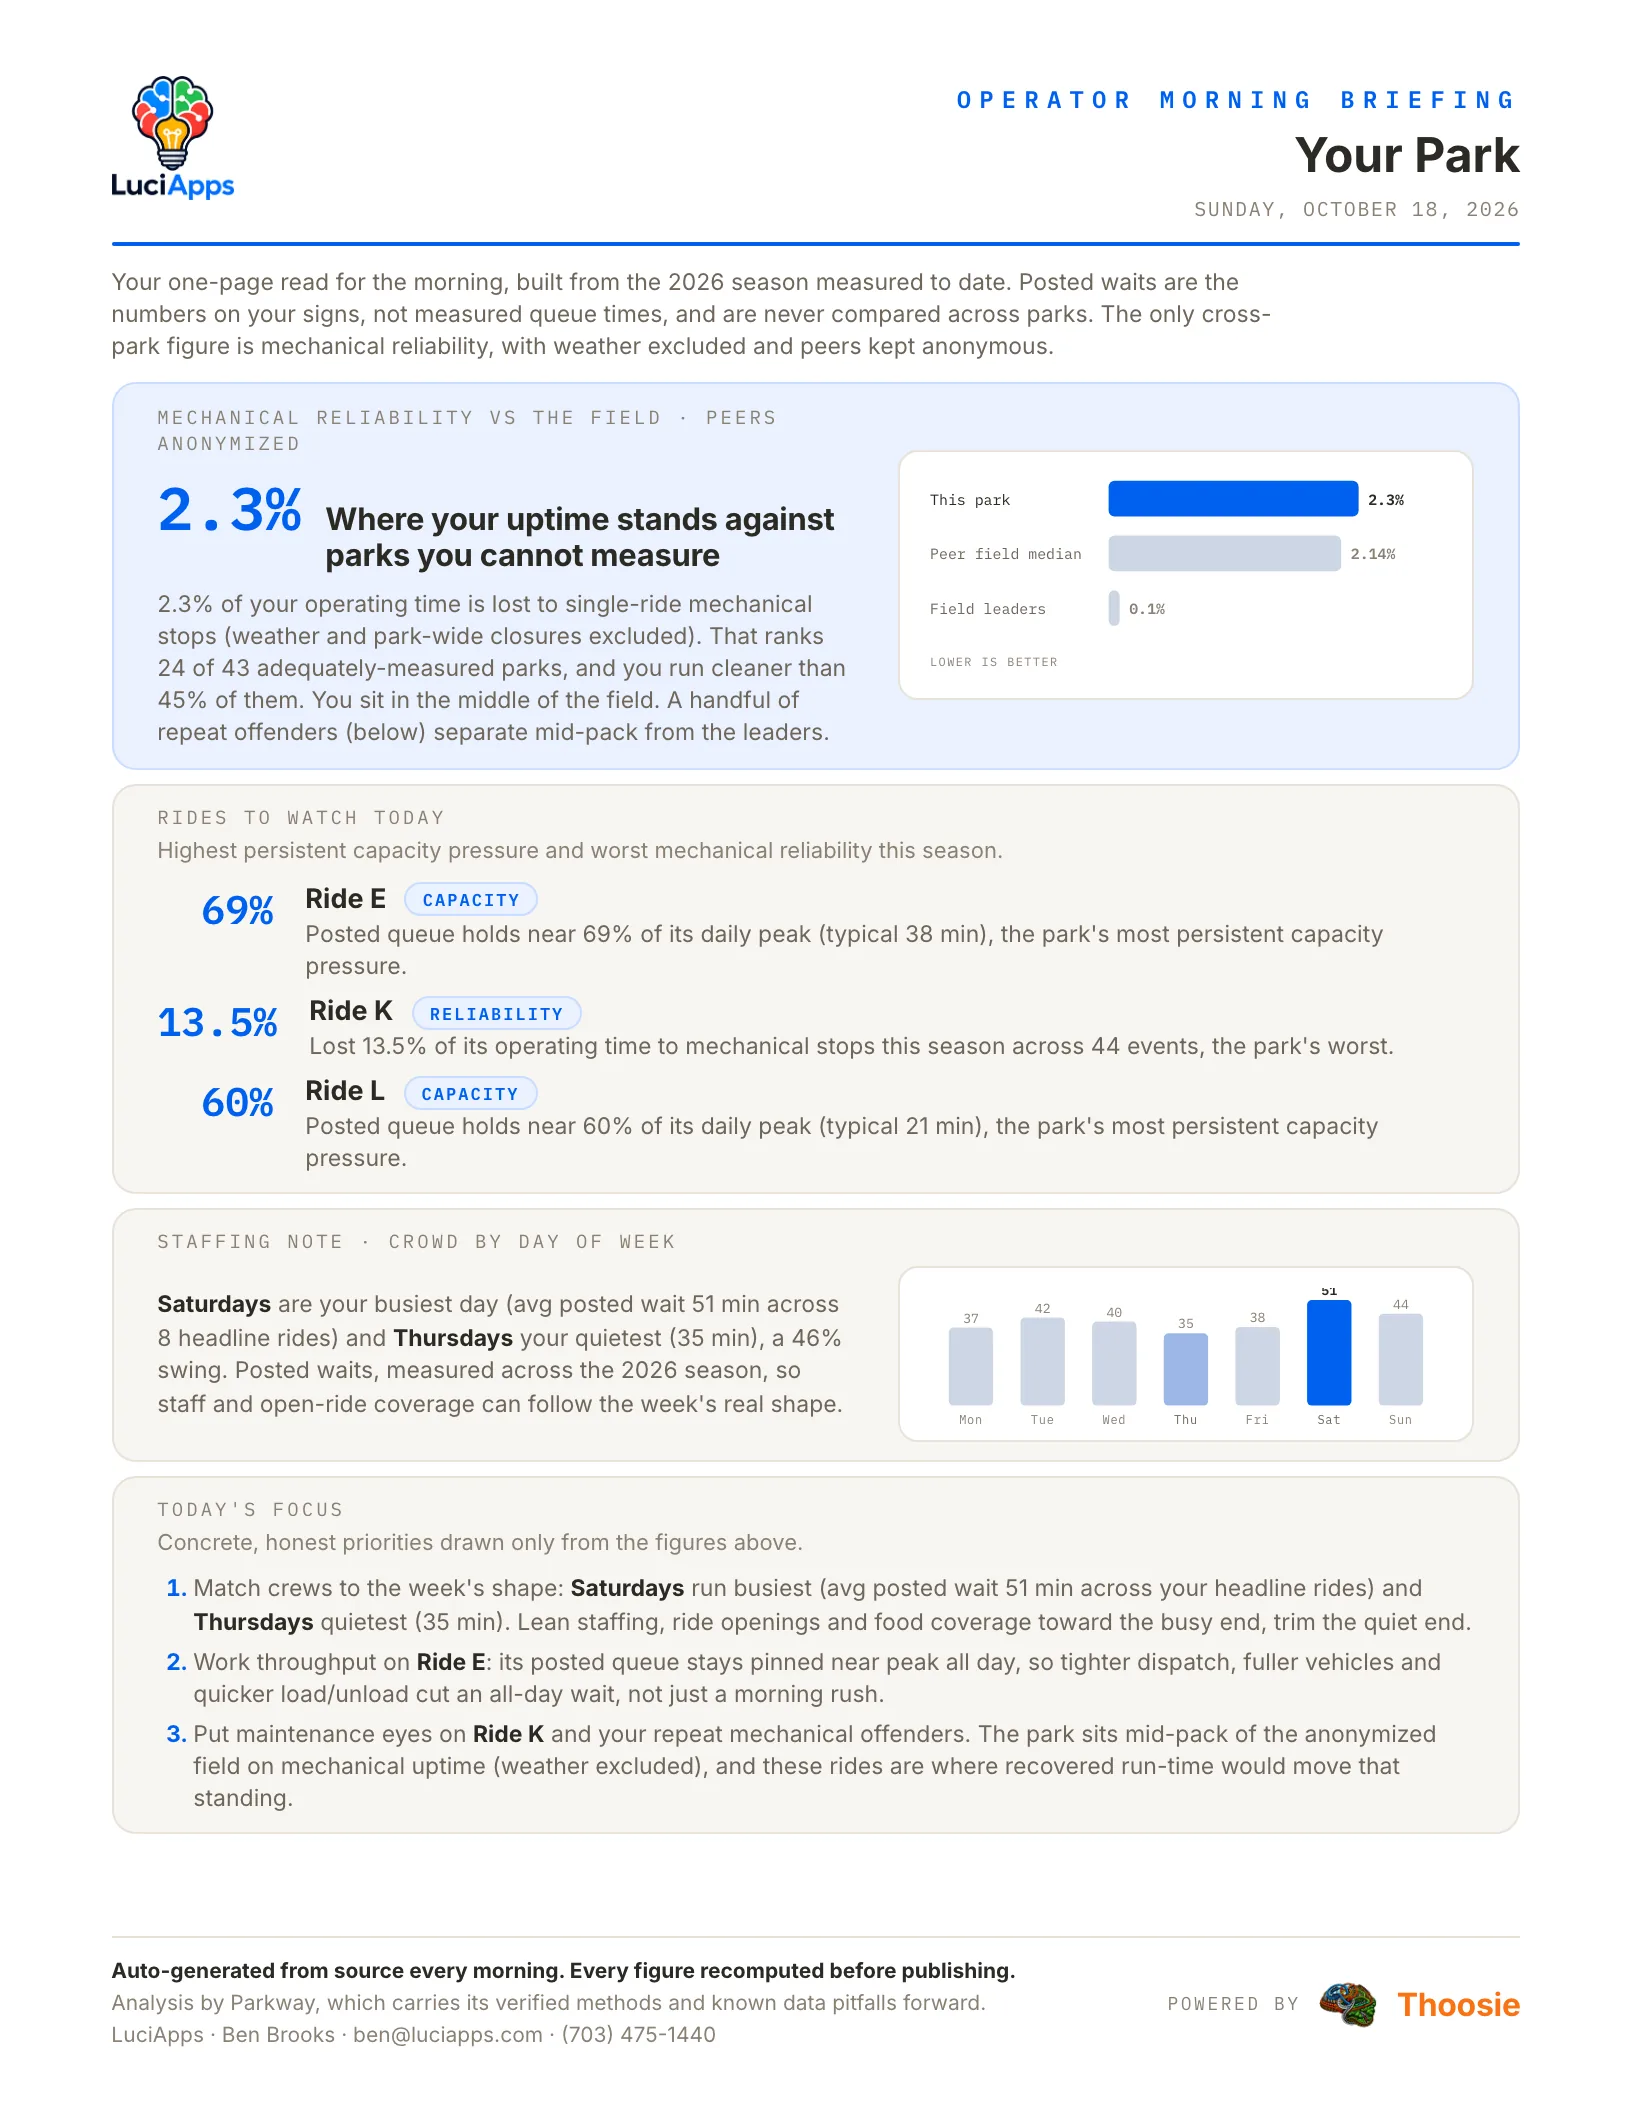
It keeps watching when nobody is asking.
Each park gets a short list of what moved: a ride whose queue stopped clearing, a coaster whose mechanical downtime rose over the last three weeks. Each item comes with its numbers and a suggested next step.
- The attention list appears only when something crosses a severity gate, and it can arrive by email.
- A one-page morning brief, rebuilt from source every morning.
- Versions of the brief for maintenance, revenue and food and beverage, and the general manager.
- Any answer saves as a one-pager you can put in front of your team.
When a chart says it better, the screen opens.
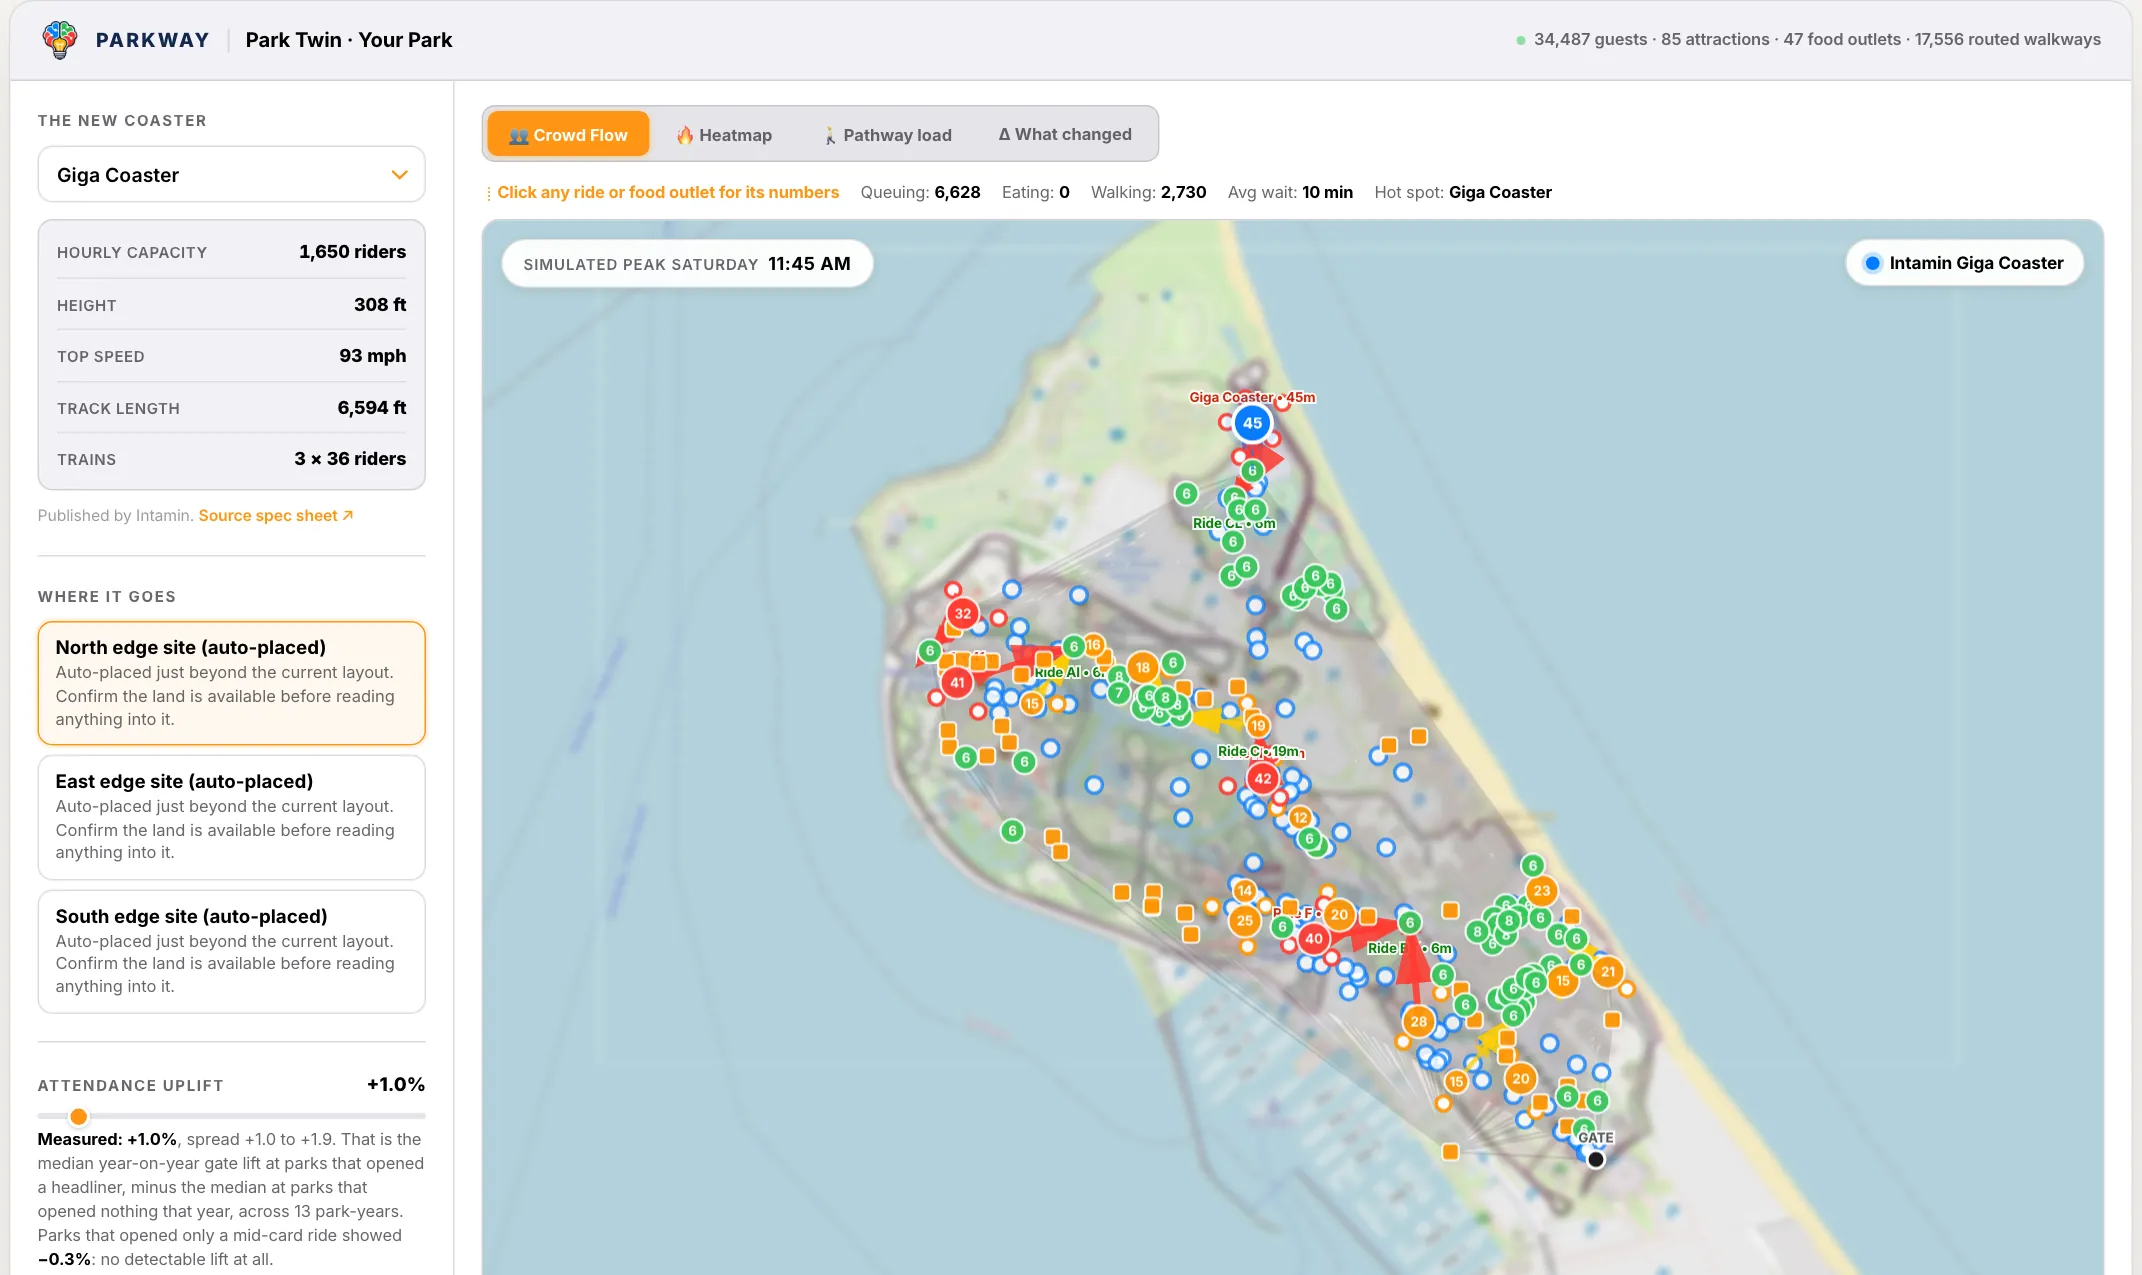
Ask about capacity and Capacity vs Demand opens. Ask what to fund and the Capex Planner opens. Every screen is computed for your park and readable on a phone.
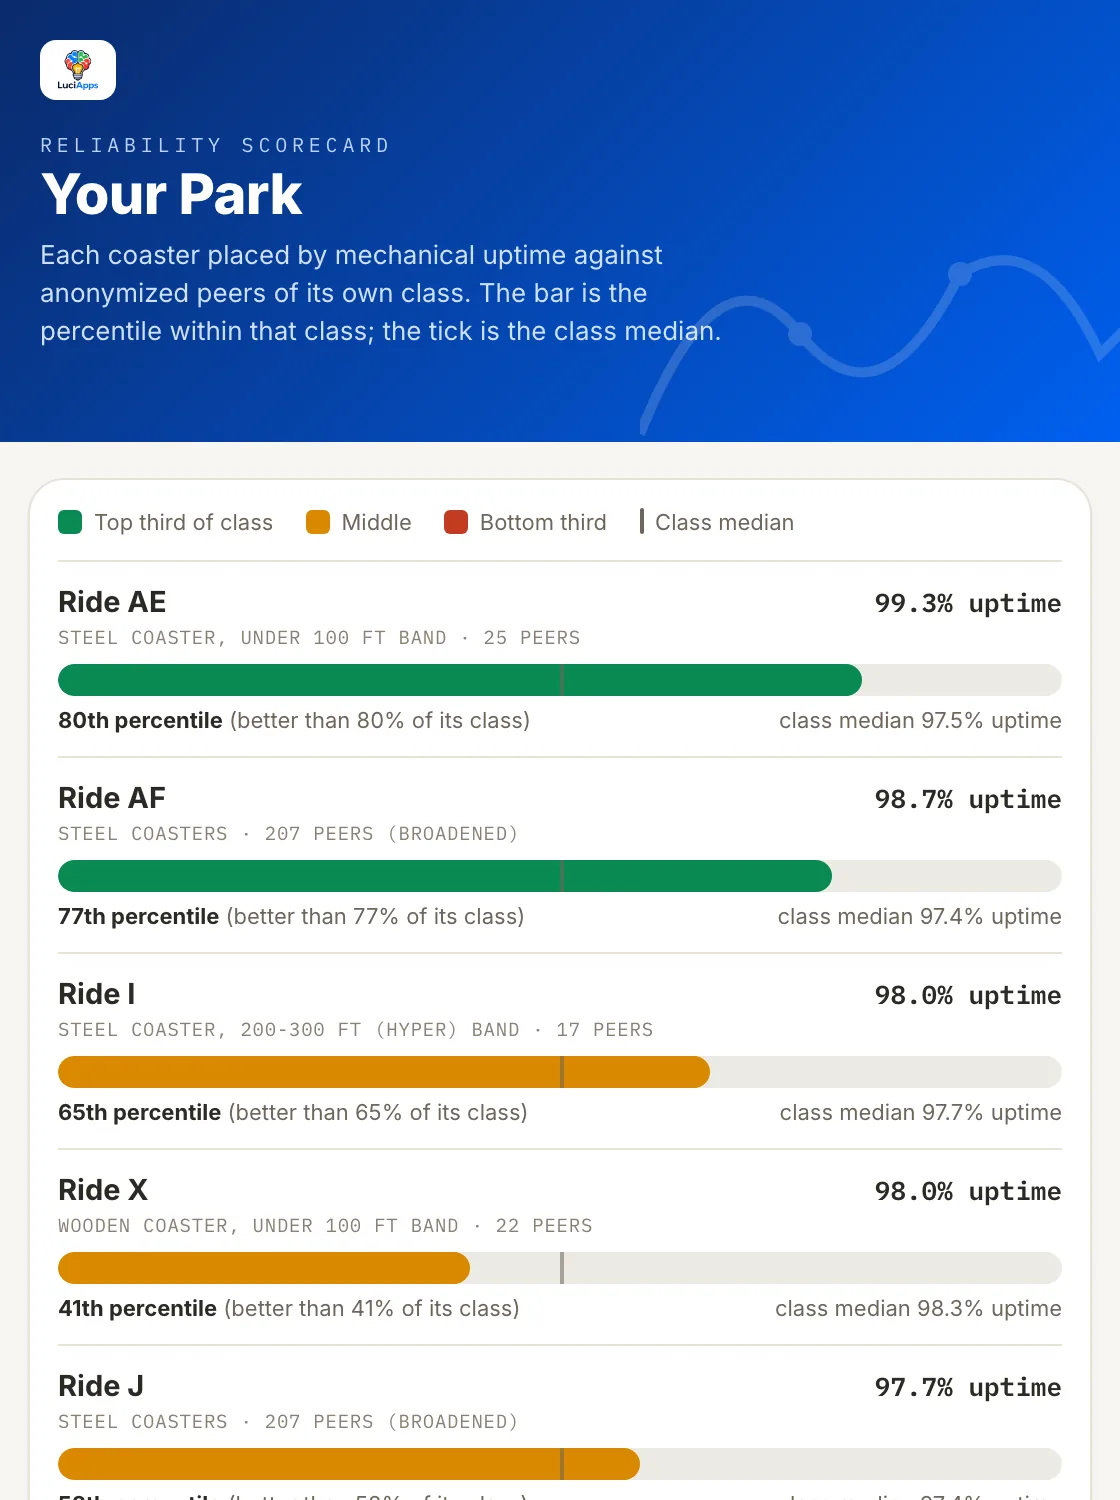
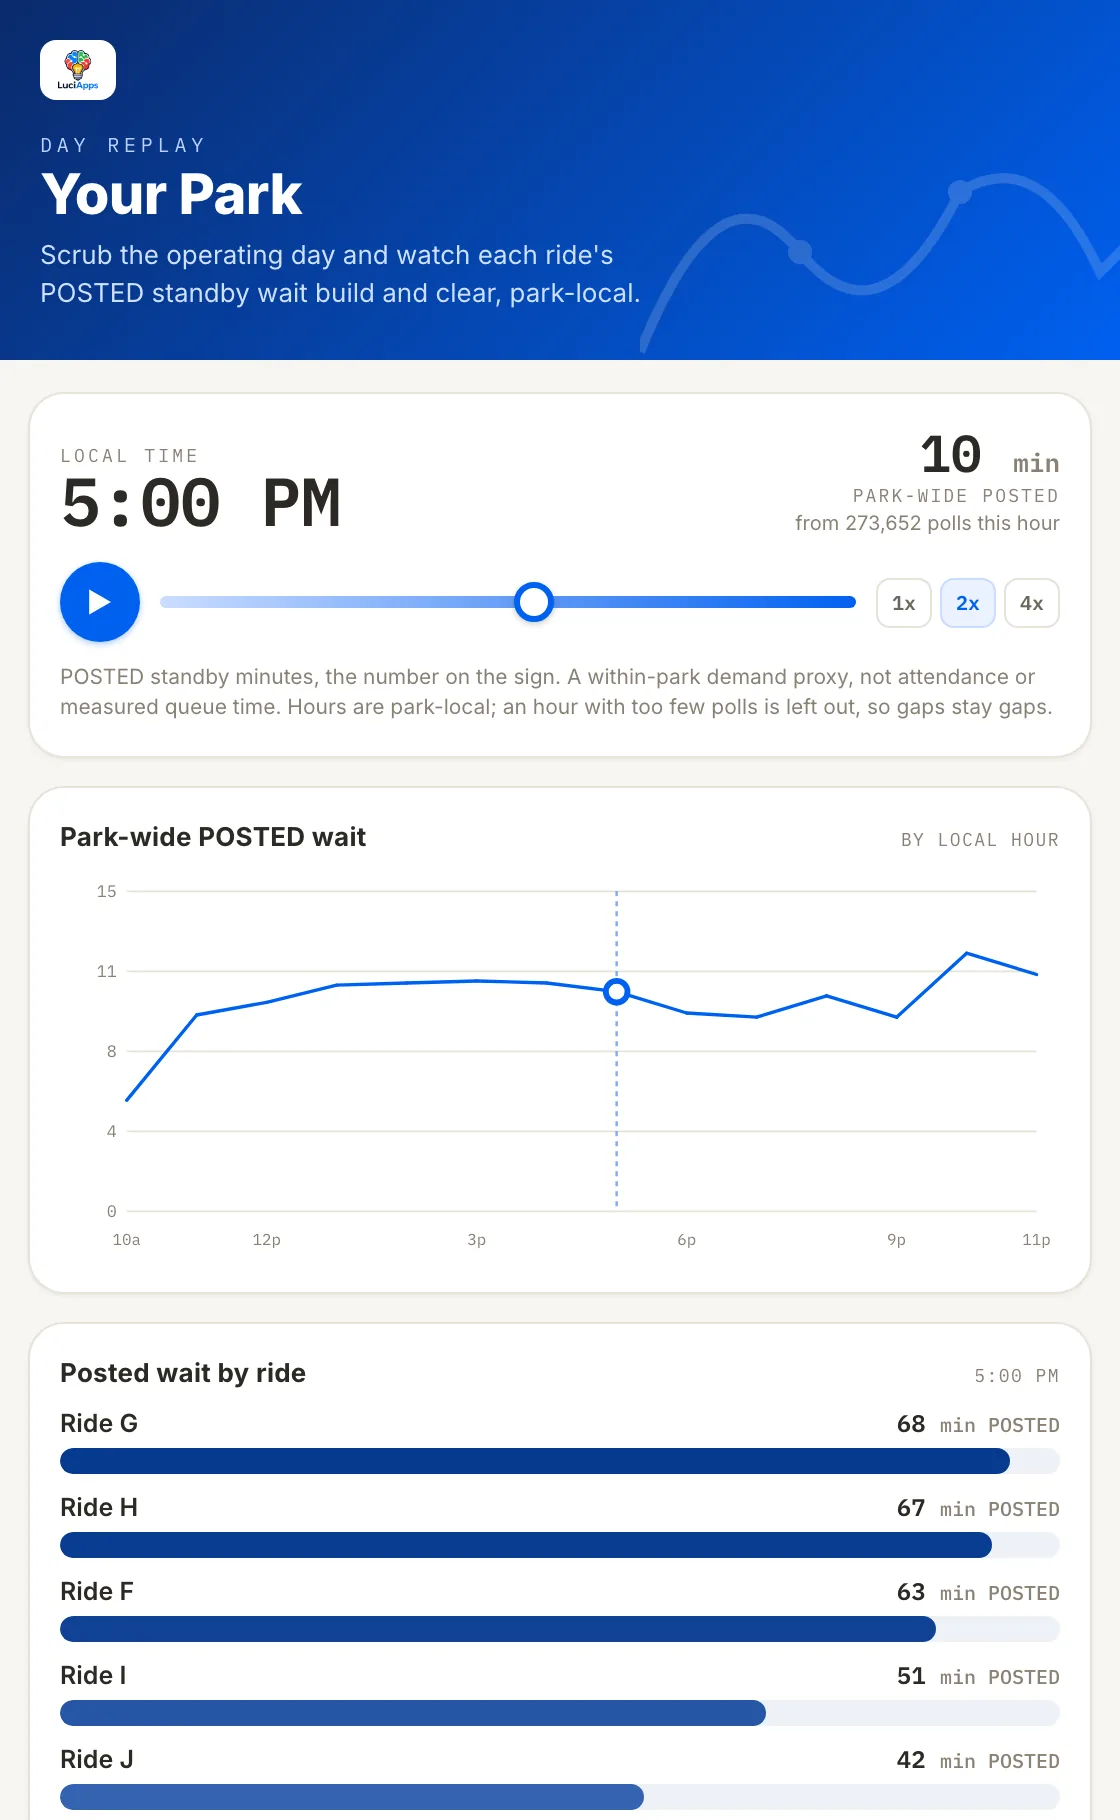
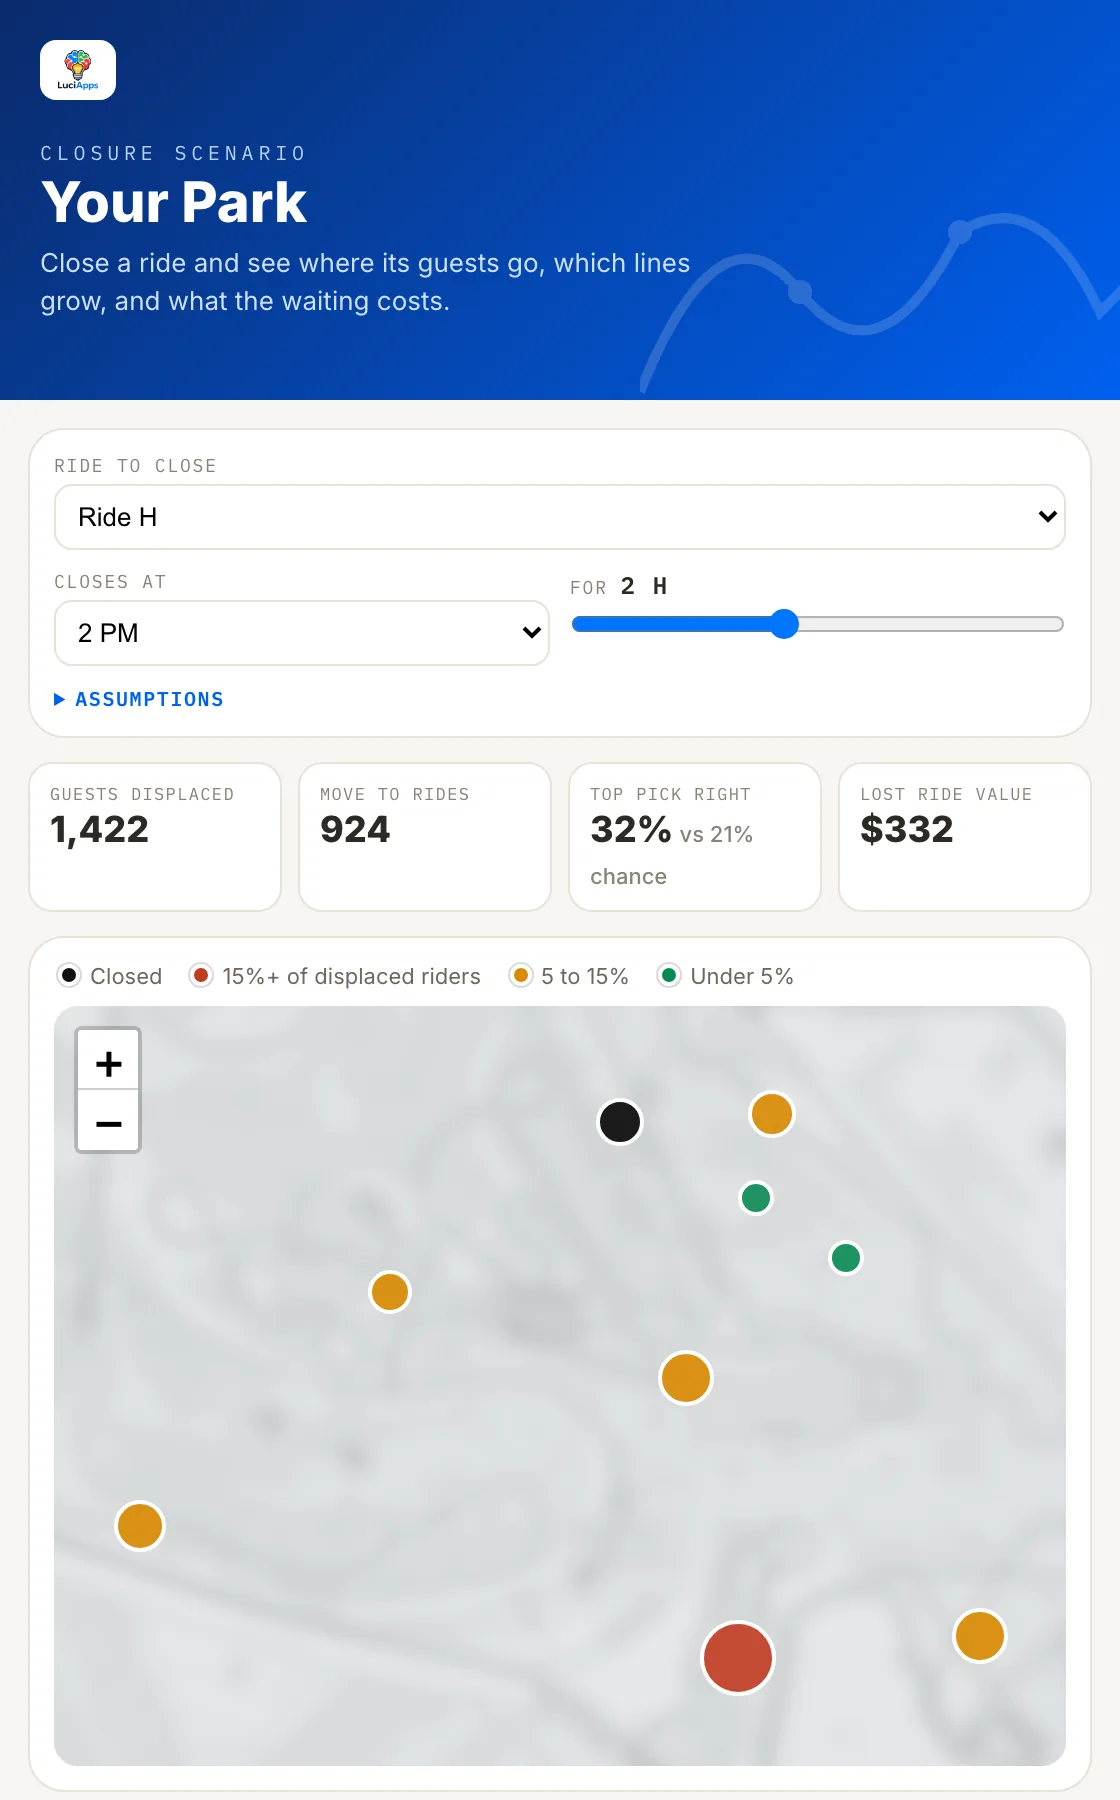
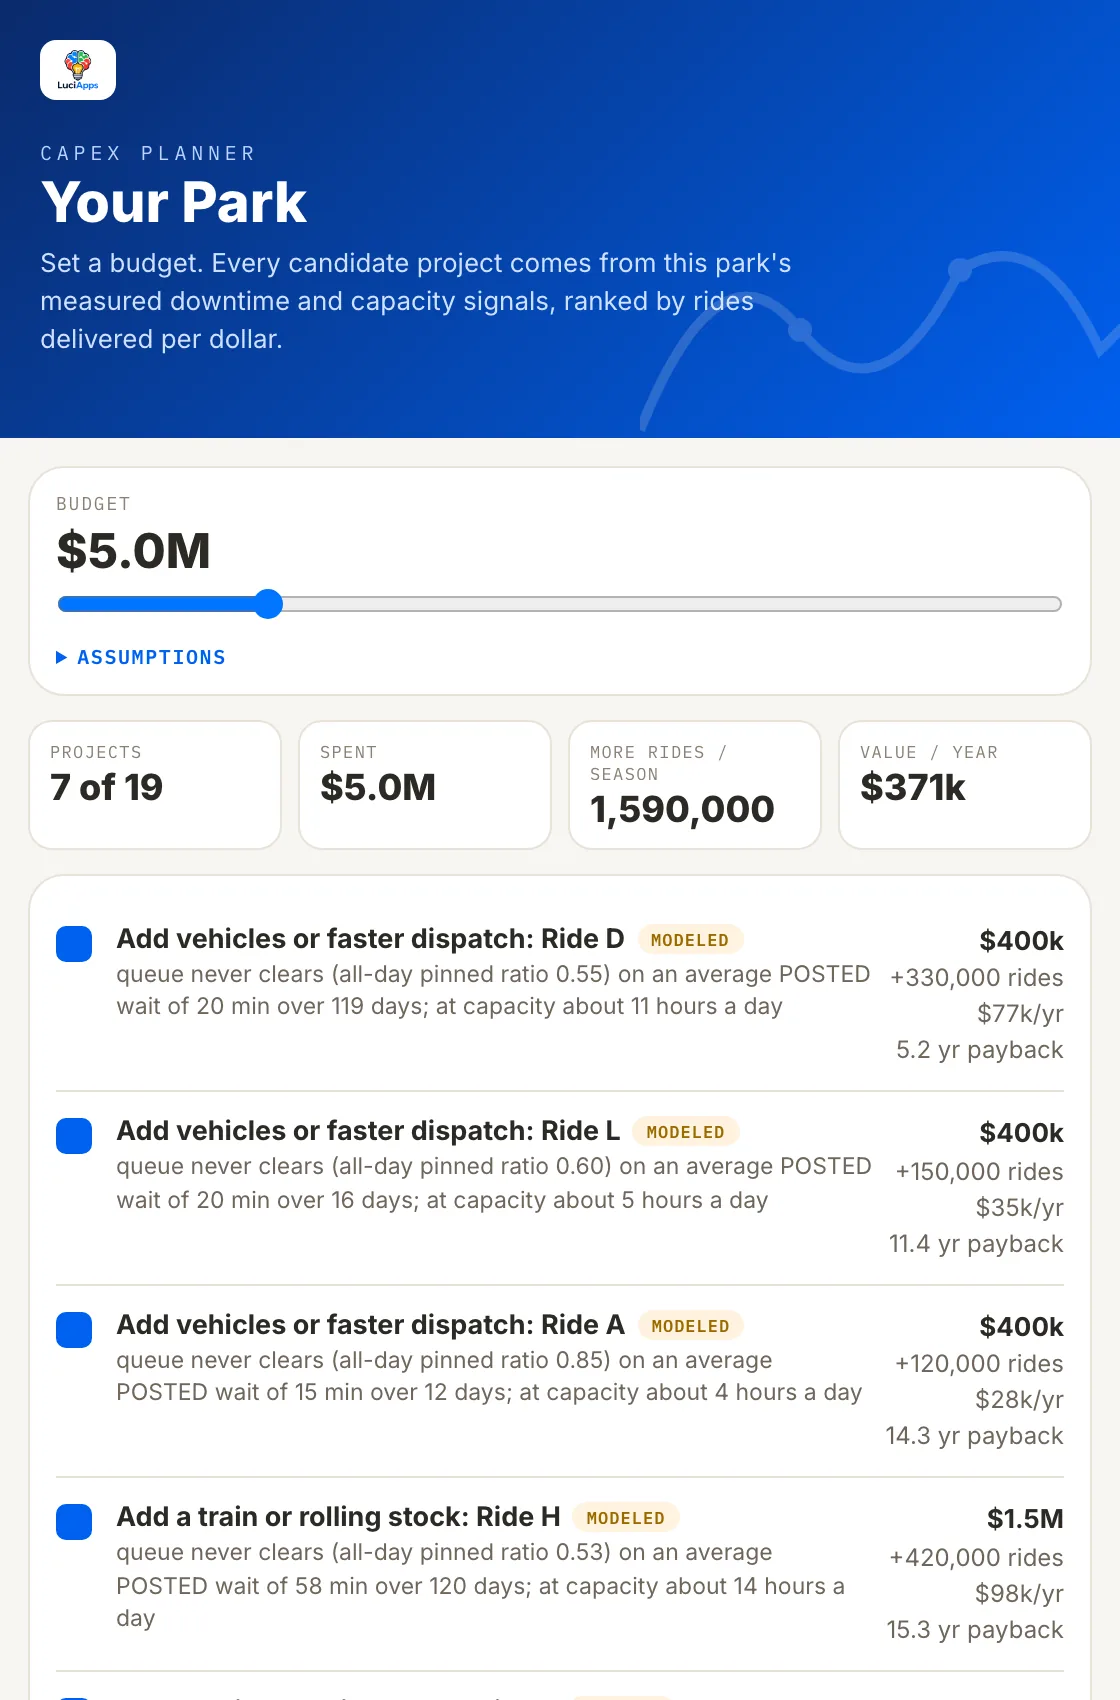
Rules it follows on every answer.
These are built into the analyses, not added as fine print. They are why its numbers can go in front of a board.
Posted waits are labeled posted.
They are the number on the sign, read within your own park, and never compared across parks as levels.
Reliability means mechanical.
Weather and park-wide closures are removed before any ride is scored, so a storm never reads as a breakdown.
Peers are counted, never named.
Any comparison group must be large enough to keep its members anonymous, including the groups you build yourself.
Like is compared with like.
Coaster comparisons use rides of the same type and height band from their spec sheets, not rides that merely share a name.
Missing data stays missing.
A week without data shows as a gap. It is never filled in, smoothed over or scored.
No method, no number.
Outside its verified analyses it says so, and points to the closest question it can answer.
Start on our data. Connect yours when you want exact.
Cross-park intelligence
Runs on the Thoosie network alone and works the day you start. Nothing to install, nothing to export.
- Posted waits read about once a minute at US and Canadian parks
- Ride status, with mechanical stops separated from weather and park-wide closures
- Weather forecasts kept exactly as they were issued
- Ride specs and park walking maps for the twin
Your systems, connected
With your approval and at a scope you control, connect your own sources and each estimate becomes a measured figure.
- Maintenance (CMMS): real downtime in place of feed-derived downtime
- Queue scanners: measured queue time in place of posted waits
- Turnstiles and point of sale: lost visits and dollars in place of a demand proxy
- Staffing rosters: coverage measured against the crowd
The analyst sees only aggregate findings, never raw records, and it can run entirely inside your own environment. How your data is handled.
What operators ask first.
Is this a chatbot?
It is an analyst with a fixed library of verified analyses and thirteen screens. A language model writes the sentences, but every figure comes from an analysis run on your park that session, with its source attached.
What does it need from us to start?
Nothing. Tier 1 runs on the Thoosie network's cross-park data. Pick your park and ask.
Will it name our competitors?
No. Peers are anonymized in every tier. You see your rank and the spread of the field, never another park's name.
Does it forecast attendance or revenue?
No. It measures operations: posted waits, ride availability, mechanical reliability and demand patterns. Forecasting revenue, attendance or guest satisfaction is outside its verified methods, and it says so when asked.
How is it priced?
Per park, per year, by tier. Connecting your own systems is scoped with you. Ask us for a quote.
See it on your own park.
Tell us your park. Before we meet, we check which analyses return findings for it, so the walkthrough runs on your numbers, not a demo park. Meeting at IAAPA Expo in Orlando, November 17 to 20? Say so in your note.