Measured first. Written second.
Parkway does not ask a language model what is true about your park. It runs verified analyses on measured data, then writes the answer from their results, with the source of each figure attached.
Five steps, every time.
- You askIn plain language, about your park, the way you would ask your best analyst.
- It picks the analysesOnly verified analyses that fit the question. If none fits, it says so here.
- It runs them on your parkFresh queries that session, on your park's measured data and the anonymized field.
- It writes from the resultsEvery figure in the answer comes from those results, with a numbered source and its caveats.
- It shows youThe matching screen opens, and the answer saves as a one-pager.
A network no single park could build.
Every comparison depends on measuring other parks, and no operator can measure its competitors. The Thoosie network does, every day.
- Over 300 million posted-wait readings from more than 130 parks, read about once a minute at US and Canadian parks.
- Ride status through the day, so a ride that closes is caught as it happens.
- Weather forecasts stored exactly as they were issued, the record needed to study what a wrong forecast does to demand.
- Ride specs and park walking maps, for clone matching and the park twin.
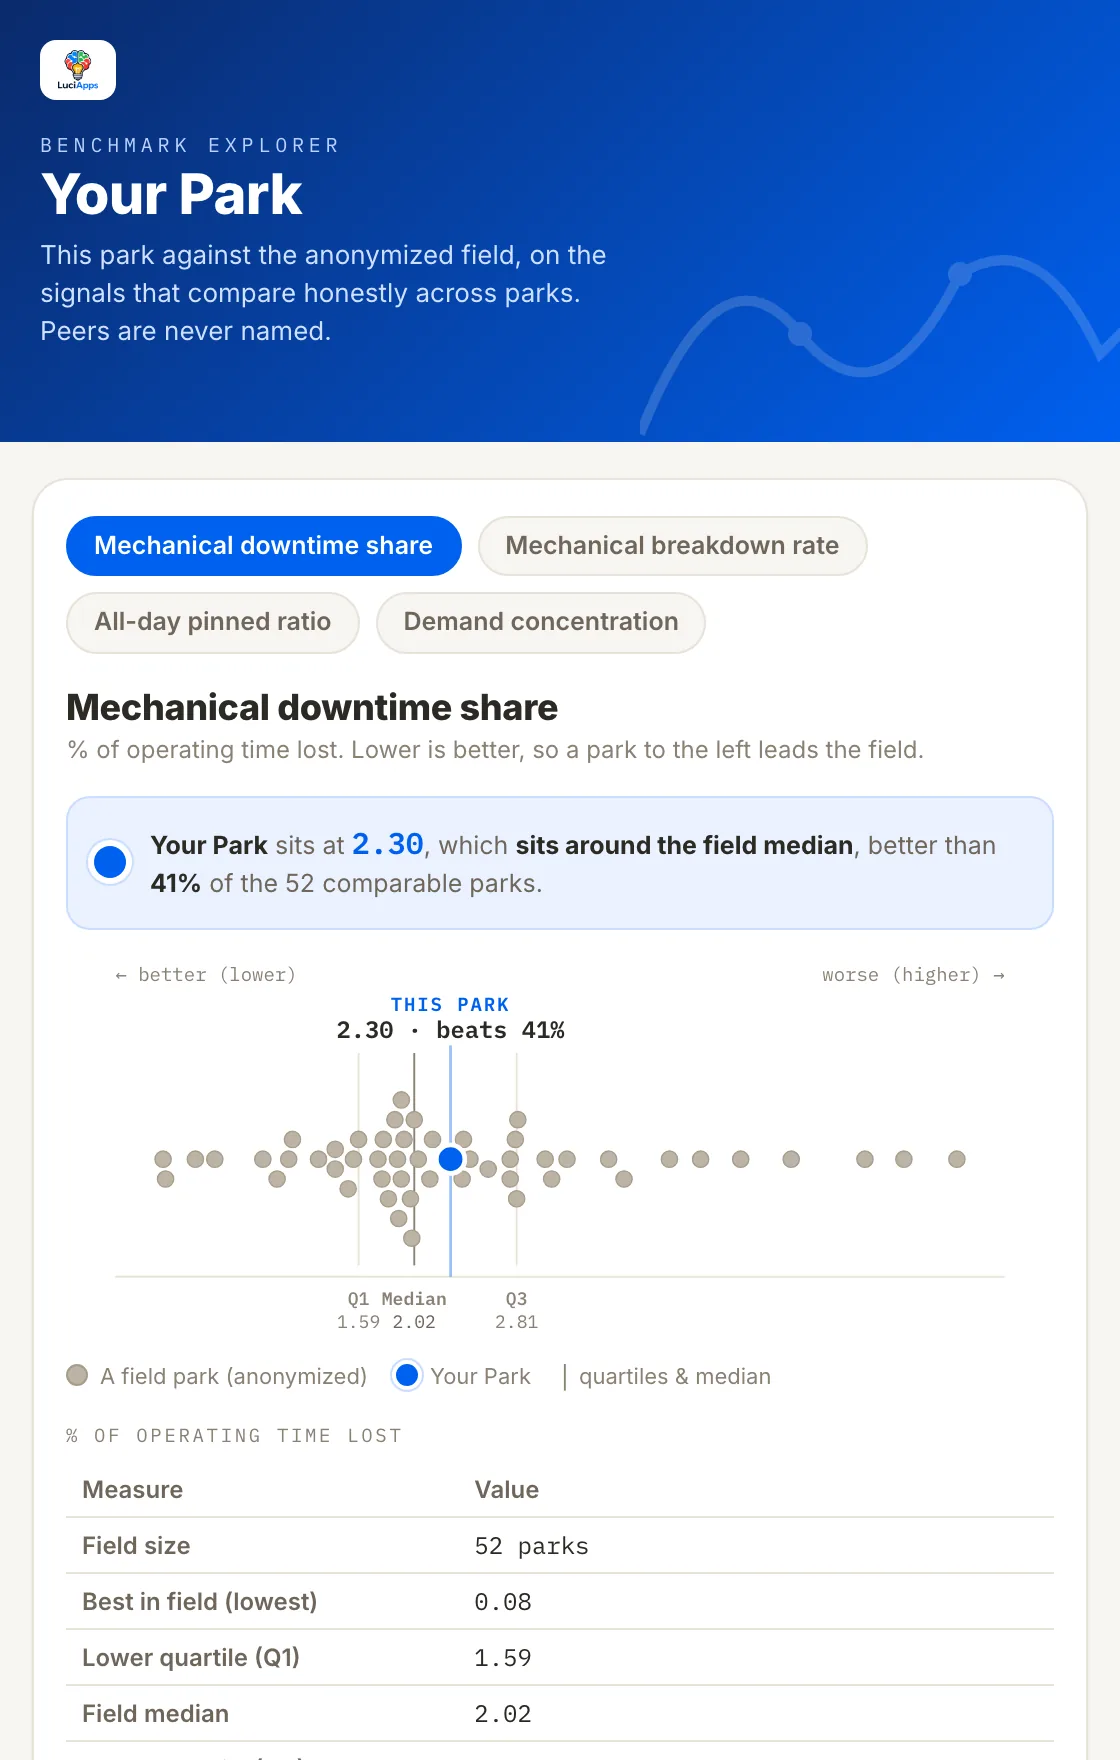
What each method measures, and what it does not.
The caveat is part of the method. It travels with every answer that uses it.
How much of the operating day a ride's queue sits near its own peak. A queue that never clears signals a throughput limit; one that spikes and clears signals demand.
Read from posted waits, not your rated capacity. Connect dispatch logs for the exact throughput gap.
How long after park open each ride starts operating, and how many open within fifteen minutes, ranked against the anonymized field.
Inferred from when a ride first appears open in the public feed, not from your control room.
Share of operating time lost to single-ride stops, compared with rides of the same type and height band at other parks.
Weather and park-wide closures excluded. Connect your CMMS for true MTBF and MTTR.
How evenly your park's queueing spreads across its rides, a ratio that holds across parks whatever their posting habits.
A within-park shape. It is never a comparison of wait levels between parks.
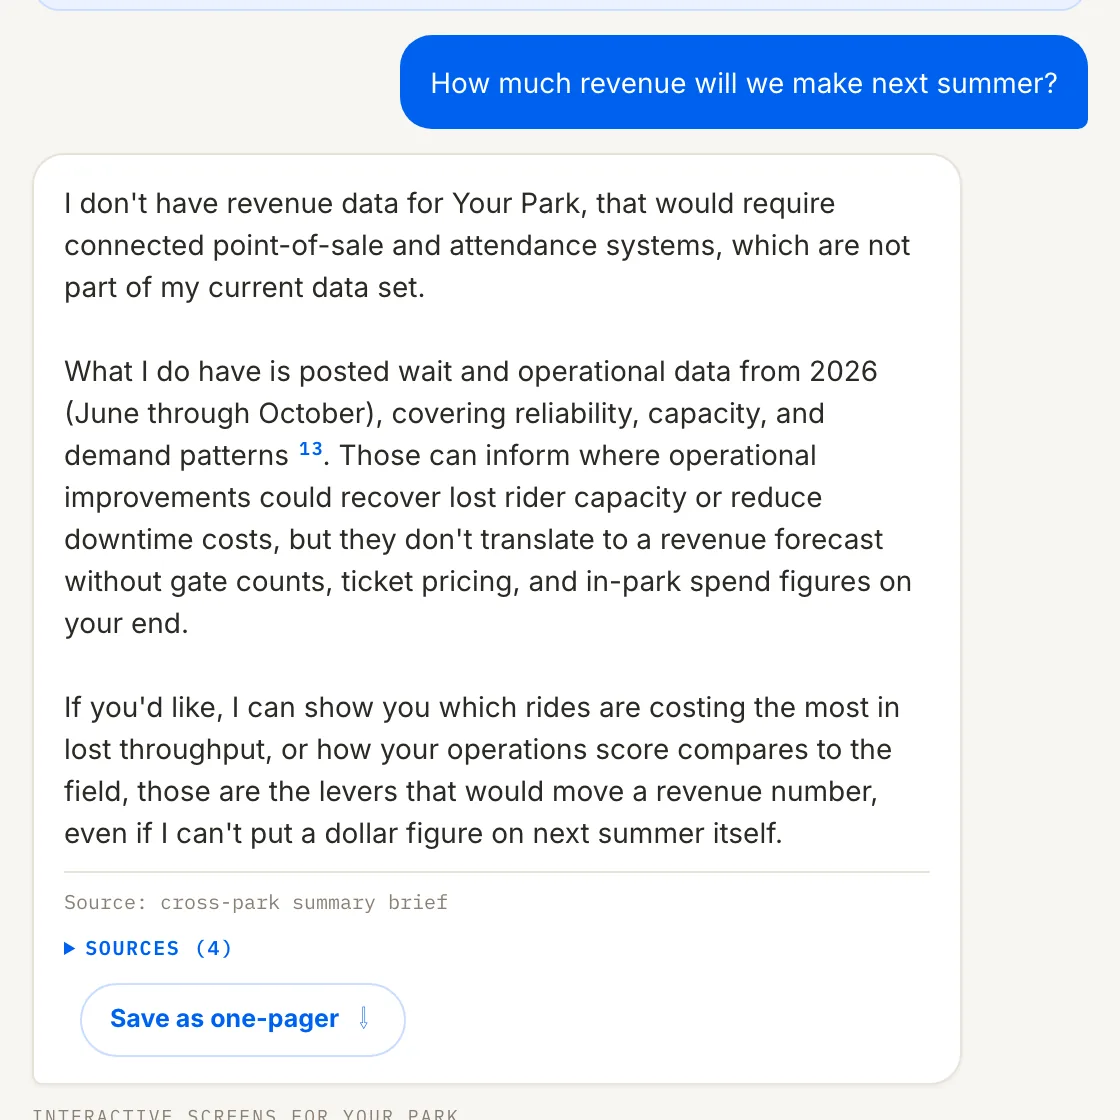
The refusals are a feature.
An analyst you can put in front of a board has to know where its knowledge stops. These limits are enforced, not suggested.
- It does not forecast attendance, revenue or guest satisfaction.
- It does not name peer parks, in any tier.
- It does not compare posted-wait levels across parks.
- It does not quote a figure it did not compute that session.
New analyses earn their place.
A new analysis ships only after its confounds are tested, against a pass bar written down before it runs. One that misses the bar is dropped, not softened. That is why the library is small, and why each number in it holds up.
The bar comes before the result
What the method must beat is fixed before the first run, so a weak result cannot be rationalized afterward.
Real events, not samples
The closure model was tested on 2,158 real unplanned breakdowns at 27 parks.
Fresh every time
Answers come from queries run that session, and the morning brief is rebuilt from source every day.
Check the method on your own numbers.
Pick the question you trust least, and we will run it on your park with every source open. That is the fastest way to judge an analyst.